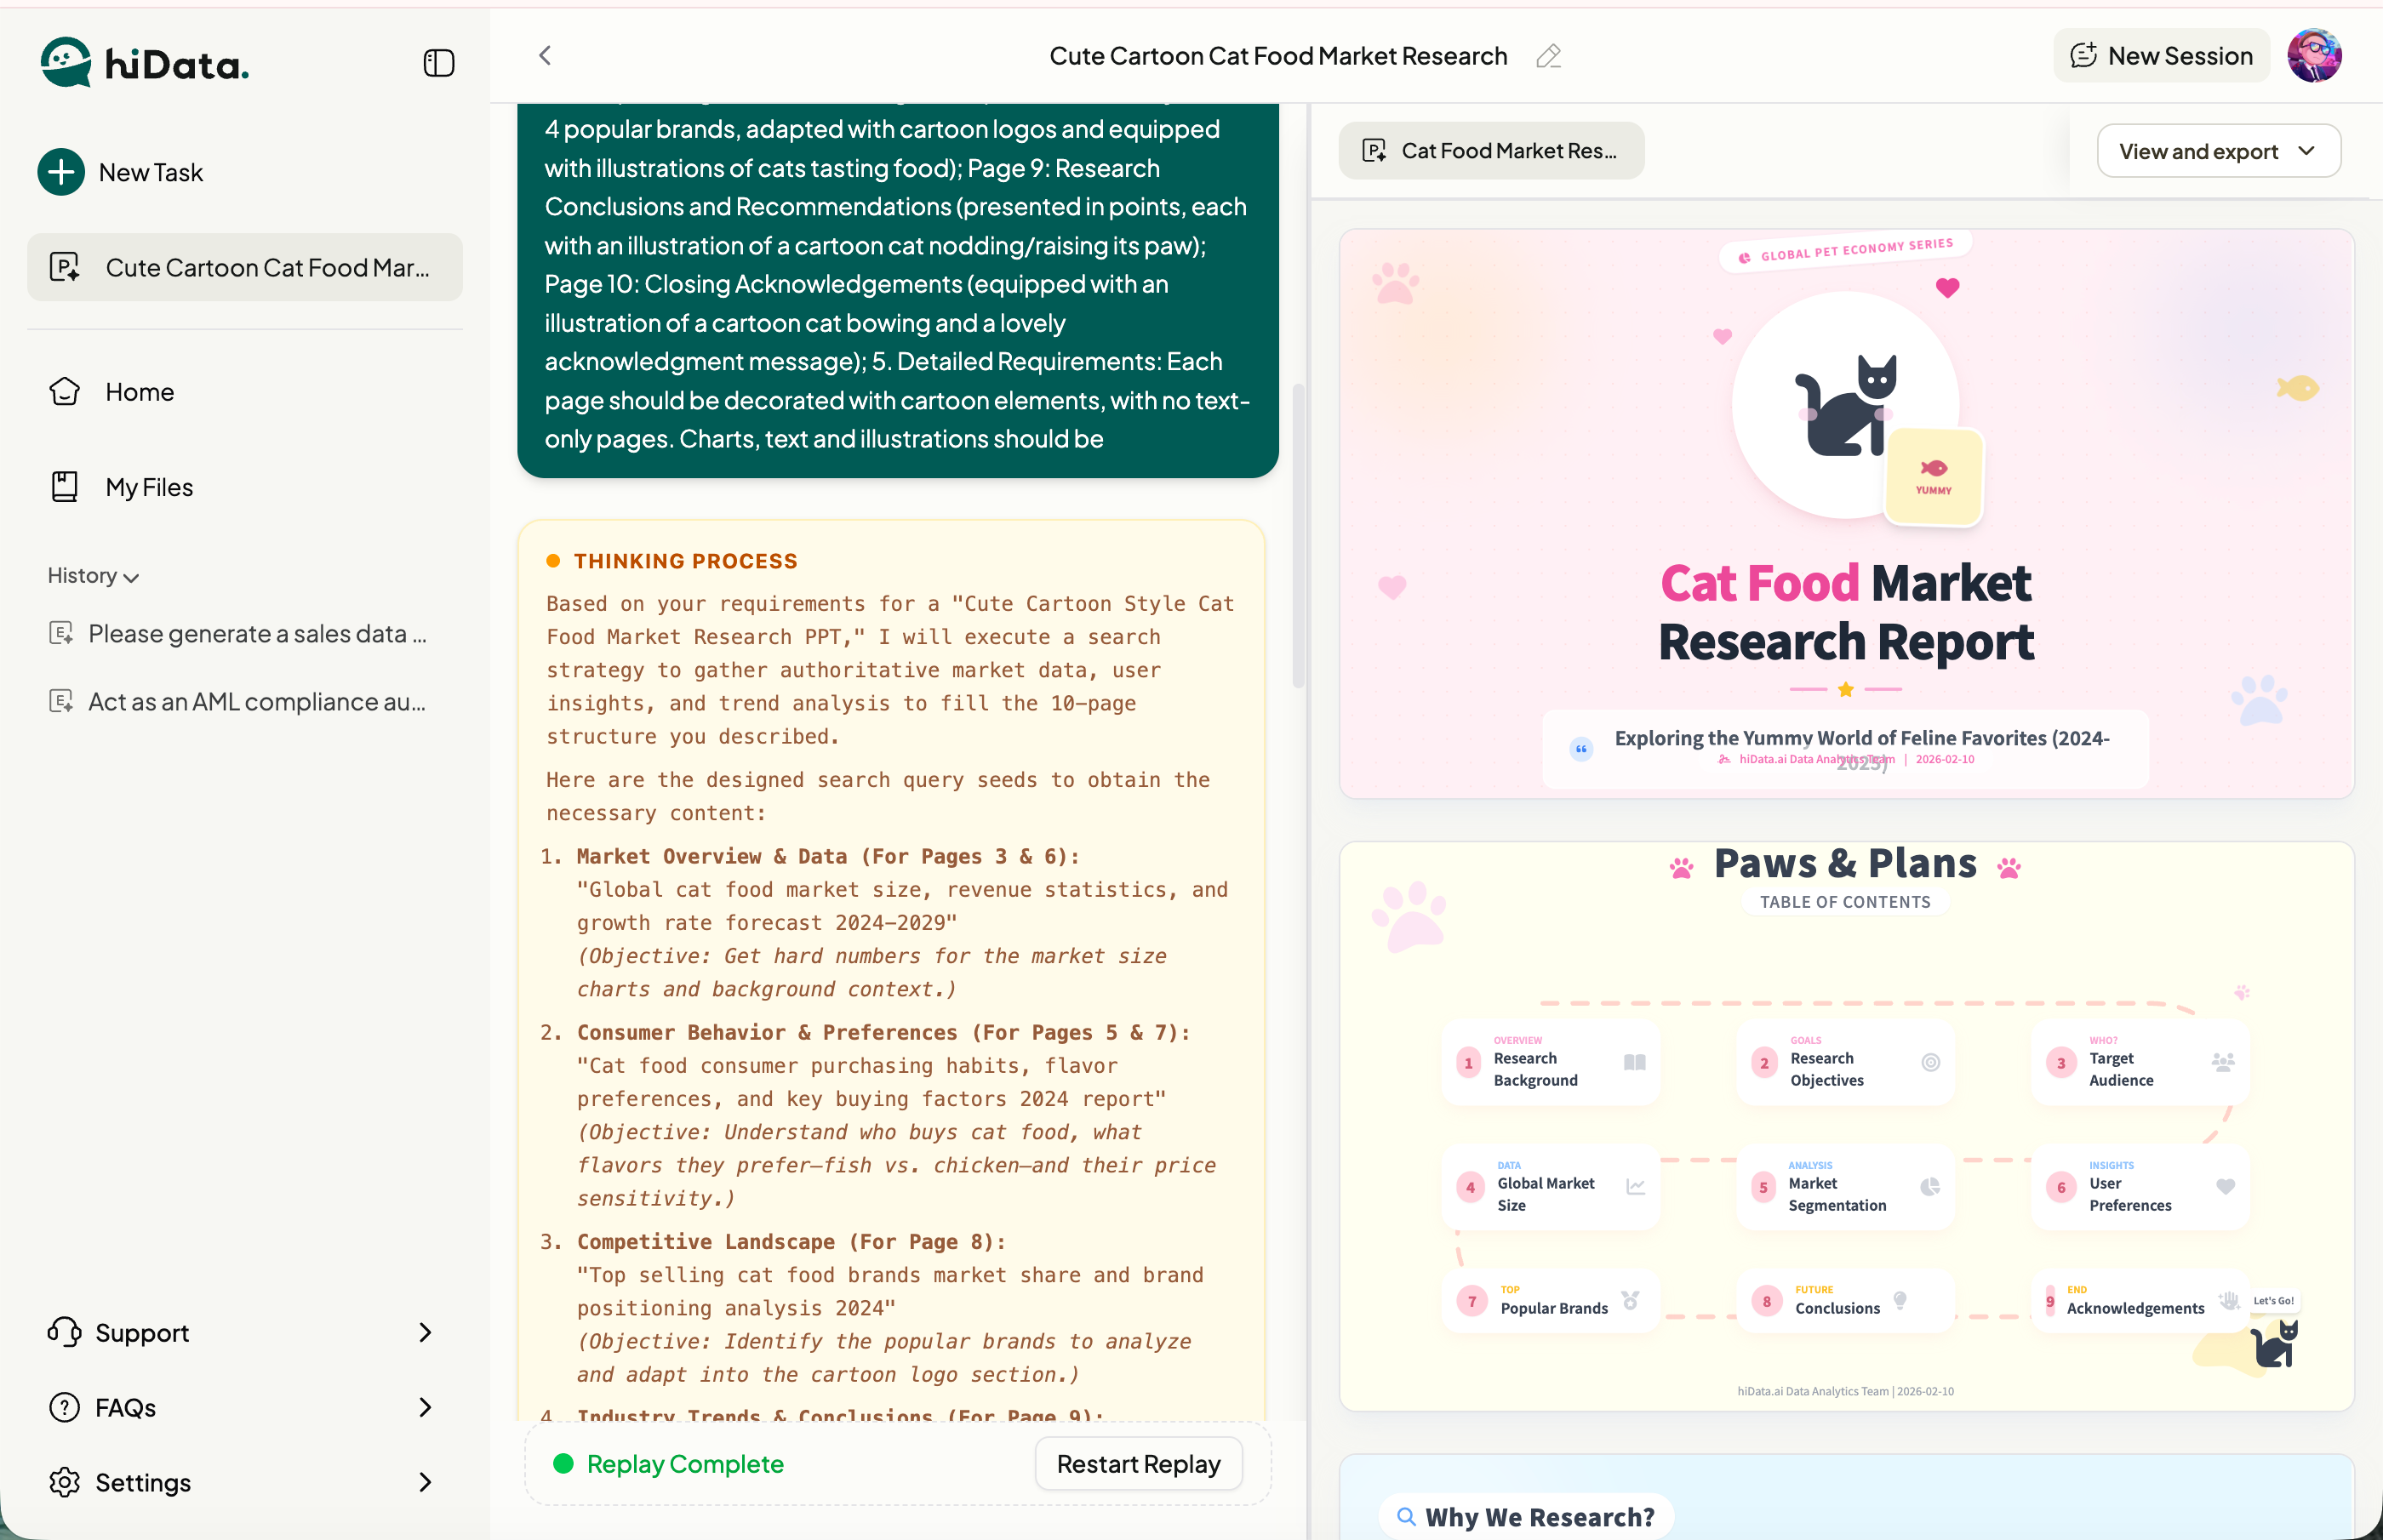
Excel to PowerPoint automation means turning spreadsheet data into repeatable slides without rebuilding every chart, table, and summary by hand. Use linked Excel charts when the same deck needs regular refreshes, use VBA or Python when a fixed template must be populated at scale, and use AI when the spreadsheet also needs cleaning, analysis, chart selection, and a written narrative before it becomes a presentation.
Choose your workflow in 20 seconds
For a one-off deck, start with a static copy or an AI-assisted draft. A one-time board update, investor summary, or client report usually does not need a complex automation system. The work is to clean the data, choose the right charts, write the story, and verify the final numbers.
For a monthly refresh, linked Excel charts are often enough. This works best when the workbook structure is stable, the deck structure is stable, and the same person or team owns the source files. The risk is that links depend on file paths, permissions, and desktop behavior.
For many decks, use a scripted template. VBA, Office Scripts, Power Automate, or Python can populate the same slide structure repeatedly. This is useful for recurring reports, customer-specific decks, or internal packs that use the same layout every cycle.
When the real bottleneck is the story, use an AI-assisted workflow. If the spreadsheet is messy, contains too many rows, or needs analysis before it becomes a deck, AI can help clean the data, identify patterns, generate charts, and draft the presentation narrative. A human still needs to verify the output.
Four ways to automate Excel to PowerPoint
There is no single best method. The right choice depends on whether the deck is one-time or recurring, whether charts must stay linked to Excel, whether the output needs to be fully editable, and whether your real bottleneck is moving objects or explaining the numbers.
| Method | Best for | What updates | Main limitation |
|---|---|---|---|
| Static copy or picture | One-off decks and final snapshots | Nothing after paste | Every data change requires a new copy |
| Linked Excel chart or range | Recurring desktop presentations | Linked chart or worksheet object | Links depend on file location, permissions, and desktop behavior |
| VBA, Office Scripts, or Python | Stable templates and repeated production | Defined slide elements and files | Requires setup, testing, ownership, and maintenance |
| AI-assisted workflow | Messy data that also needs analysis and narrative | Analysis, visuals, summaries, and a presentation draft | Numbers and explanations still require human review |
Method 1: static copy for a controlled snapshot
Static copy is not sophisticated, but it is often correct for a board pack, investor update, or client deck that must preserve exactly what was approved on a specific date. Copy a chart or table as a picture when the underlying data should not change after sign-off.
The advantage is control. Nobody can accidentally refresh a chart after the numbers are approved. The limitation is obvious: if the workbook changes, the slide does not change. That makes static copy appropriate for final snapshots, not living dashboards.
To use this method safely, label the reporting period and source date on the slide. If the chart is copied from a workbook, keep the workbook version used for the final deck. This avoids confusion later when someone asks why the slide no longer matches the latest spreadsheet.
Method 2: link Excel charts for a recurring desktop deck
When the workbook and slide structure stay stable, link the Excel chart or worksheet object to PowerPoint. In supported desktop workflows, linked worksheet data can be refreshed after the source workbook changes. This is the familiar monthly-reporting setup: update Excel, open PowerPoint, refresh the link, and review the deck.
This method works best when both files have stable names and locations. It should be tested from another user's device before it becomes the official workflow. A link that works for the creator may break for a colleague if the source file lives in a local folder or if permissions are different.
PowerPoint for the web and desktop PowerPoint do not always behave the same way, so do not assume every linked-chart workflow will work in every environment. If the deck needs to be shared externally, consider whether the recipient should see linked objects, static images, or a clean exported deck.
Method 3: populate a fixed template with scripts
Scripts are useful when the output is highly repeatable: the same slide numbers, placeholders, charts, and validation rules are used every week or for many customers. VBA suits controlled Windows desktop workflows. Office Scripts can prepare and validate Excel workbooks and can be triggered through workflow tools. Python can generate decks from a governed template when engineering owns the pipeline.
The benefit is control. A script can pull from known ranges, place charts in fixed positions, update titles, export files, and apply a template consistently. The cost is maintenance. If a column name changes, a chart placeholder is renamed, or the template changes, the script may need to be updated.
This method works best when the reporting format is stable and the team has someone responsible for testing. It is less helpful when the business question changes every month or when the input workbook needs interpretation before slides can be written.
Method 4: use AI when analysis is part of the work
Traditional automation moves prepared numbers into known placeholders. AI becomes useful earlier, when the workbook first needs to be cleaned, classified, summarized, and converted into a narrative. For example, a monthly finance file may contain inconsistent account names, blank periods, mixed units, and dozens of rows that should not all appear in the deck.
AI Sheets can help clean spreadsheet data, process tables, generate charts, and surface visual insights through natural-language instructions. AI Slides can then help turn the reviewed analysis into reports, dashboards, and business presentations.
The product boundary matters. This workflow starts with uploaded Excel or CSV files and produces analysis and presentation output. It does not claim a live two-way link to an Excel workbook, a direct ERP or database connection, or an unattended scheduled refresh. If you need the same deck to refresh automatically every month, combine a linked or scripted method with the AI-assisted analysis process.
A practical AI workflow from Excel to PowerPoint
1. Prepare a reliable workbook
Keep one header row, one row per record, consistent date and currency formats, and stable category names. Separate source data from calculations and presentation outputs. Remove merged headers, hidden subtotal rows, and duplicated totals that could distort the analysis.
This step is less glamorous than slide generation, but it determines whether the final presentation can be trusted. A workbook with mixed units, hidden rows, or repeated subtotal lines can produce a polished deck with wrong numbers. Prepare the workbook before asking AI to summarize it.
2. Define the audience and the decision
Do not start with "make a presentation." State who will read it and what they need to decide. A CFO review needs variances and risks. A sales meeting needs pipeline movement and actions. A client deck may need outcomes, methods, and next steps.
The same Excel file can support several different decks. A management deck may need a concise story and action items. An operations deck may need exceptions, owners, and next steps. A board deck may need trend, risk, and strategy. Defining the audience keeps the generated slides from becoming a workbook pasted into PowerPoint.
3. Analyze the data before designing slides
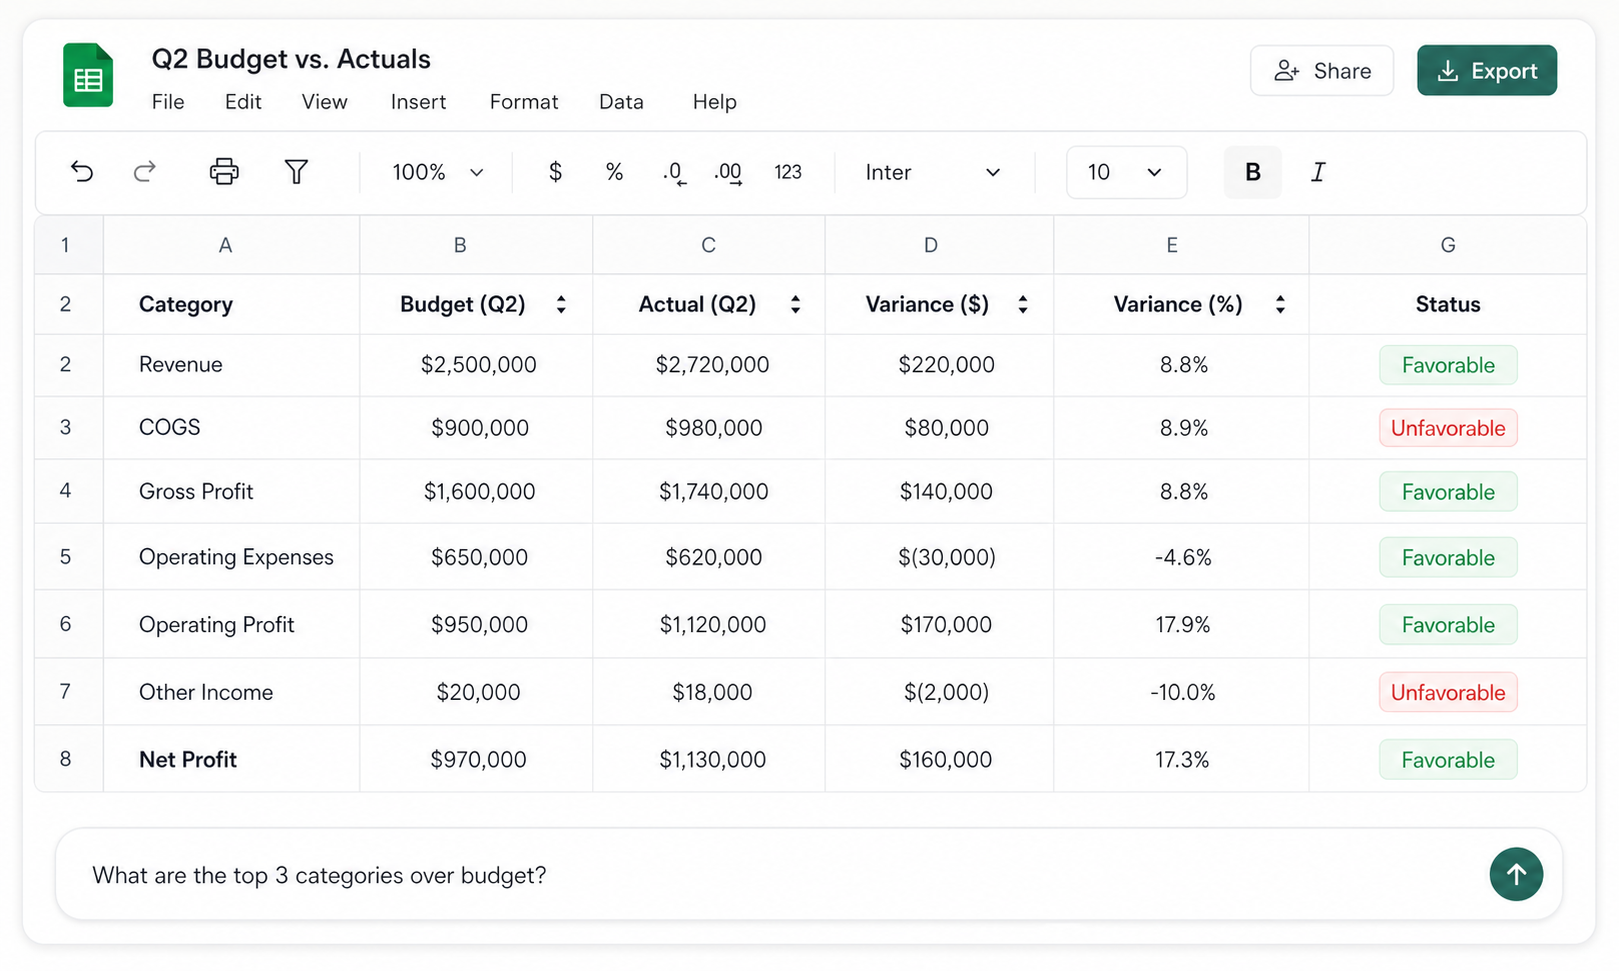
Upload the Excel or CSV exports to AI Sheets. Ask it to verify columns, calculate the required KPIs, flag missing values, identify material changes, and cite the source rows behind each conclusion. Review the resulting table before requesting charts or commentary.
This is where the workflow differs from simple chart automation. The goal is not just to move a chart into PowerPoint. The goal is to decide which chart should exist, what it should prove, and whether the numbers behind it are reliable.
4. Turn findings into a slide plan
Ask for an outline before generating the deck. Each slide should answer one question and use only the evidence needed for that answer. Approve the story order, chart choice, and headline conclusions before spending time on visual polish.
A slide plan prevents the common mistake of turning every worksheet into a slide. It also helps separate evidence from interpretation. A good outline says what the slide should show, what decision it supports, and which numbers need verification.
5. Generate, verify, and export
Build the presentation in AI Slides, then compare every KPI, chart label, reporting period, and written conclusion with the approved analysis. Correct unsupported explanations, apply the right brand template, and export the final presentation only after the checks pass.
The final review should be treated as part of the workflow, not an optional last look. Automation can make a wrong number look more professional. Verification is what keeps the final deck useful.
Prompts for the spreadsheet-to-slides workflow
Good prompts define the source, the comparison, the audience, and the verification rule. Run the analysis in stages instead of asking for a polished deck immediately.
Review this workbook before analysis. List the sheets, identify the header row, check date and currency formats, flag missing values or duplicate records, and tell me which totals should not be counted as source rows.
Compare actual results with budget and the prior period. Calculate dollar and percentage variance, identify the five most material changes, and cite the source rows. Do not invent causes that are not present in the file.
Create a six-slide management review outline for a finance leadership meeting. Give each slide one decision-focused headline, one recommended visual, the supporting metrics, and a note describing what still requires human verification.
Example: a monthly finance review
Assume the workbook contains monthly revenue, cost of goods sold, operating expenses, net profit, budget, and prior-period values. The audience is the management team. The purpose is to explain performance and agree on follow-up actions, not to reproduce the entire workbook on slides.
| Slide | Purpose | Output |
|---|---|---|
| Slide 1 | Executive summary | Four verified KPIs and three decision-ready takeaways |
| Slide 2 | Revenue versus plan | Trend, budget gap, and the largest visible contributors |
| Slide 3 | Margin movement | Revenue, COGS, gross margin, and period comparison |
| Slide 4 | Operating expense exceptions | Material favorable and unfavorable variances |
| Slide 5 | Cash and forecast implications | What the current result changes in the next planning cycle |
| Slide 6 | Actions and owners | What must be investigated, decided, or corrected next |
This structure deliberately leaves detailed account rows in the workbook. The deck carries the decision, evidence, and next action; the spreadsheet remains the traceable source.
Quality controls that prevent a polished wrong answer
Automation makes mistakes repeatable, so the validation process matters as much as the generation method. Assign one person to own the workbook, one approved reporting cut-off, and one final review checklist.
- Reconcile every headline KPI to an approved workbook cell or calculation.
- Show units, currency, period, comparison basis, and data refresh date.
- Confirm that totals and subtotals have not both been included.
- Check negative numbers, percentage points, and favorable or unfavorable labels.
- Separate visible evidence from a proposed explanation.
- Test linked files or scripts from another user's account and device.
- Remove hidden workbook content before embedding a file in a deck.
- Stop publication when a required check fails; do not replace missing evidence with confident language.
The purpose of these controls is not to slow the process down. It is to stop automation from scaling a mistake. A manually built deck may have one wrong chart. An automated deck workflow can repeat the same error across every monthly report unless the check is built into the process.
Common automation failures
The linked chart does not refresh
Confirm that the source workbook still has the same name and location, that the viewer has permission to open it, and that the workflow is running in a supported PowerPoint desktop environment. Reconnect the source if the path changed.
The deck contains correct charts but weak conclusions
The automation is moving objects but not answering a business question. Define the audience, decision, comparison period, and materiality threshold before generating the slide outline.
The AI explains causes that are not in the workbook
Change the prompt so the model separates observations from hypotheses and cites source rows. Add operational notes when a known event explains the result. Delete unsupported causes from the final deck.
The presentation becomes too large or slow
Avoid embedding entire workbooks when a chart, summarized range, or image is sufficient. Compress images, limit hidden workbook content, and test the final file on the device used for presenting.
Frequently asked questions
Can PowerPoint update automatically from Excel?
Yes. In supported desktop workflows, linked Excel data or charts can be refreshed after the workbook changes. File paths, permissions, and platform differences still need to be tested.
What is the best way to automate Excel to PowerPoint?
Use linked charts for a recurring deck with a stable workbook, scripts for fixed templates at scale, and AI when data preparation, analysis, visual selection, and narrative drafting are also part of the task.
Can AI create a PowerPoint presentation from Excel data?
AI can help clean data, calculate comparisons, find patterns, generate charts and summaries, and create a presentation draft. It should not replace the person responsible for approving the numbers and conclusions.
How should Excel data be structured before creating slides?
Use one header row, consistent data types and units, one row per record, stable category names, and separate source, calculation, and output areas. Remove merged headers and duplicated totals.
Do I need VBA?
No. VBA is one option for controlled desktop templates. Linked objects, Office Scripts, Python, and AI-assisted workflows cover different needs.
How do I prevent incorrect numbers in an automated deck?
Use a validation sheet, reconcile every headline number, define the refresh date and units, review exceptions, and block publication whenever a required check fails.
Sources and further reading
- Microsoft Support: Insert and update Excel data in PowerPoint
- Microsoft Support: Link to an Excel chart from your presentation
- Microsoft Learn: Run Office Scripts with Power Automate
- python-pptx documentation
Turn your next spreadsheet into a presentation-ready story
Clean and analyze the data with AI Sheets, shape the narrative with AI Slides, and verify every number before sharing. Try hiData with your spreadsheet.