
Small business data analytics is the practice of turning the information you already collect - such as sales exports, customer orders, inventory counts, and marketing results - into answers you can use to run the business. It does not require an enterprise data warehouse or a team of analysts to get started.
For many small businesses, the most useful first questions are simple:
- Which products, services, or customers drive the most profitable revenue?
- Where are sales growing or slowing down?
- Which inventory items need attention?
- Which marketing activities create qualified demand?
This guide explains what small business analytics looks like in practice, which metrics to start with, and how to build a repeatable process from spreadsheet data to decisions.
What is small business data analytics?
Small business data analytics is the process of collecting, cleaning, combining, and examining business data to identify patterns and support decisions. The goal is not to create a dashboard for every possible metric. The goal is to answer a specific business question reliably enough to take action.
For example, a retailer might combine monthly sales and inventory exports to find fast-selling products that risk going out of stock. A service business might group invoices by customer segment to see which clients generate the most repeat work. A marketing team might compare leads, conversion rates, and spend by channel before changing its budget.
The key difference between reporting and analysis is the next step. A report shows what happened. Analysis helps explain what changed, where to look next, and what decision to test.
Why data analysis matters for small businesses
Small teams often have limited time, disconnected tools, and data that lives in spreadsheets. That makes it tempting to rely on intuition alone. Intuition is valuable, but a regular analytics habit can make it easier to spot changes before they become expensive problems.
Useful small business analytics can help you:
- Prioritize the products, services, and customer segments that matter most.
- Identify declining sales, rising costs, or unusual order patterns sooner.
- Reduce manual work required to prepare weekly or monthly reports.
- Give owners and operators a shared view of the numbers behind a decision.
- Test changes to pricing, promotions, inventory, or acquisition channels with clearer evidence.
Start with decisions that recur. If you review stock levels every week or decide where to spend marketing budget every month, those are strong candidates for a simple, repeatable analysis.
The four data sources to start with
You do not need every system connected before you begin. Start with one or two exports that can answer an important question.
1. Sales and order data
Sales data is usually the best first source because it connects directly to revenue. A basic sales export may include order date, product or service, quantity, price, discount, customer, sales channel, and location.
Use it to answer questions such as:
- Which products generate the most revenue and which generate the most orders?
- How does this month compare with the same period last month or last year?
- Are certain regions, channels, or customer groups growing faster?
- Where are discounts increasing without a corresponding increase in volume?
2. Customer data
Customer data can come from your ecommerce platform, POS, CRM, booking tool, or invoicing system. Keep the analysis practical: segment customers by order frequency, total spend, first purchase date, or location.
This helps you find repeat buyers, customers at risk of not returning, and the segments worth serving better. Make sure access and use of customer data follow your privacy obligations and internal policies.
3. Inventory and operations data
For product businesses, inventory data can reveal whether stock is aligned with demand. Compare units sold, on-hand quantity, reorder thresholds, and lead times. For service businesses, the equivalent may be staff utilization, project backlog, appointment capacity, or delivery time.
The goal is to identify exceptions: stock that may run out, stock that is not moving, or operational steps that are creating delays.
4. Marketing and website data
Marketing data can include campaign spend, leads, website traffic, email engagement, and conversion events. Look beyond traffic volume. A channel that produces fewer visits may still be more useful if it produces higher-quality leads or purchases.
Seven metrics worth tracking first
The right metrics depend on your business model. Rather than tracking dozens of numbers, choose a small set that connects to an operating decision.
| Business area | Starter metrics | Decision supported |
|---|---|---|
| Sales | Revenue, order count, average order value, growth rate | Which products or channels deserve attention? |
| Customers | Repeat purchase rate, orders per customer, customer concentration | How can retention or service improve? |
| Products | Revenue by product, units sold, discount rate | What should you promote, review, or retire? |
| Inventory | On-hand stock, stock cover, sell-through rate | What should be reordered or discounted? |
| Marketing | Leads, conversion rate, cost per qualified lead | Where should the next budget go? |
| Operations | Fulfillment time, backlog, error rate | Where is the process slowing down? |
| Cash flow | Invoices due, collections timing, recurring expenses | What needs follow-up before it becomes a cash issue? |
Define each metric before you report it. For instance, document whether revenue is gross or net of refunds, which dates determine a reporting period, and how you define a qualified lead. Consistent definitions make trends more trustworthy.
A simple small business analytics workflow
Step 1: Start with one decision
Avoid beginning with "build a dashboard." Start with a decision you need to make, such as:
Which products should we reorder for next month?
Then list the fields needed to answer it: product, order date, units sold, current stock, supplier lead time, and reorder point. This keeps the work focused.
Step 2: Export and clean the data
Most small business data analysis starts with CSV or Excel exports. Before looking for patterns, check the basics:
- Are column names clear and consistent?
- Are dates stored as actual dates?
- Are duplicate rows present?
- Are currency, quantity, and percentage fields formatted as numbers?
- Are missing values explained or safely handled?
Cleaning is not glamorous, but it prevents misleading charts and totals. Keep a copy of the original export and document the transformations you apply.
Step 3: Create a compact analysis table
Group the data by the dimension that matches your question. For a sales review, that might be product, month, region, or acquisition channel. Calculate only the measures that help you choose an action.
For example, a monthly product table could include revenue, units sold, average selling price, month-over-month change, current inventory, and an attention flag. Sort it to surface the largest changes rather than reviewing every row equally.
Step 4: Visualize the decision, not every field
Use a small number of charts that make the answer easy to see:
- A line chart for sales over time.
- A bar chart for the top and bottom products or channels.
- A table with conditional formatting for inventory or customer exceptions.
Every chart should have a clear question behind it. If a chart does not change a decision or prompt an investigation, remove it.
Step 5: Write down the action and review date
End each analysis with a short record: what changed, the likely reason, the action owner, and when you will check the result. This turns data work into an operating routine rather than a one-off report.
Example: turning a sales CSV into an action list
Imagine a small retailer exports three months of orders with these fields: order date, SKU, product name, quantity, revenue, discount, and sales channel.
First, group the rows by product and month. Next, calculate revenue, units sold, average discount, and month-over-month revenue change. Finally, compare the results with current inventory.
The output might show three actionable patterns:
- A top-selling item has grown for two consecutive months but has low stock cover. Review the reorder timing.
- A product has high unit sales only when deeply discounted. Check its margin before continuing the promotion.
- A product has plenty of inventory but falling sales. Review its placement, pricing, or whether it should be bundled.
Notice that this workflow does not require a live enterprise BI system. It begins with an export, a clear question, and a repeatable analysis.
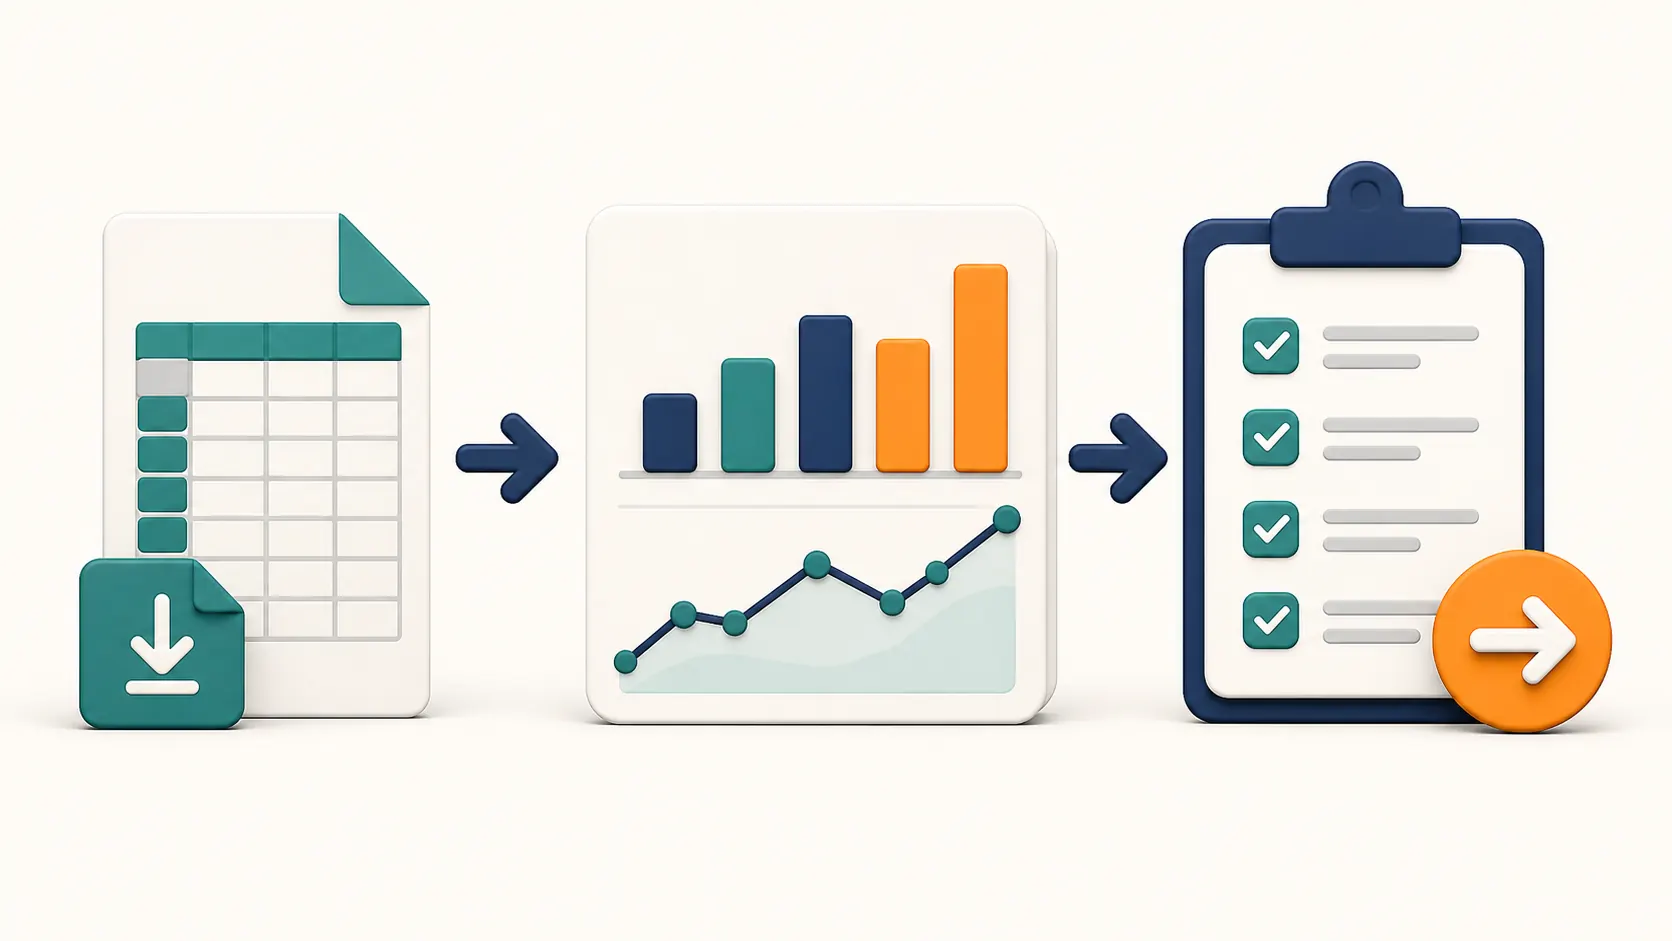
A spreadsheet export becomes useful once it ends in a prioritized action list rather than another report.
Common mistakes to avoid
Tracking too many KPIs
More metrics do not automatically mean better decisions. Start with a small set tied to sales, customers, inventory, or operating capacity. Add a metric only when someone can explain what they would do differently if it moved.
Comparing inconsistent periods
Seasonality can make a month-to-month comparison misleading. Where possible, compare the same number of days, the same weekday mix, or the same period last year. Note promotions, stockouts, and one-time events that affected the result.
Treating messy data as final
Duplicate customer names, missing dates, inconsistent SKU codes, and mixed currencies can distort the output. Establish a simple cleanup checklist and run it every time you import a new export.
Confusing correlation with a decision-ready explanation
If sales rose after a campaign, the campaign may have contributed - but seasonality, stock availability, or channel changes could also matter. Treat an interesting pattern as a prompt to investigate and test, not automatic proof.
Choosing a tool before defining the question
Spreadsheets, dashboards, and AI tools can all be useful. Choose the workflow after you know what data you have, what decision you need to make, and how often the analysis must be repeated. If you are comparing spreadsheet-based options, this guide to AI spreadsheet tools can help.
How AI can help with small business data analysis
AI can lower the effort required to clean exports, combine related tables, summarize changes, and create charts from a plain-language request. It is most useful when the task and expected output are clear.
For example, with hiData AI Sheets you can upload spreadsheet files and describe the work you need in natural language, such as: "Clean these two sales exports, group revenue by product and month, flag products with declining sales, and create a chart." hiData is designed for spreadsheet-based work including cleaning, merging, transforming, and analyzing files. Learn more about hiData AI Sheets.
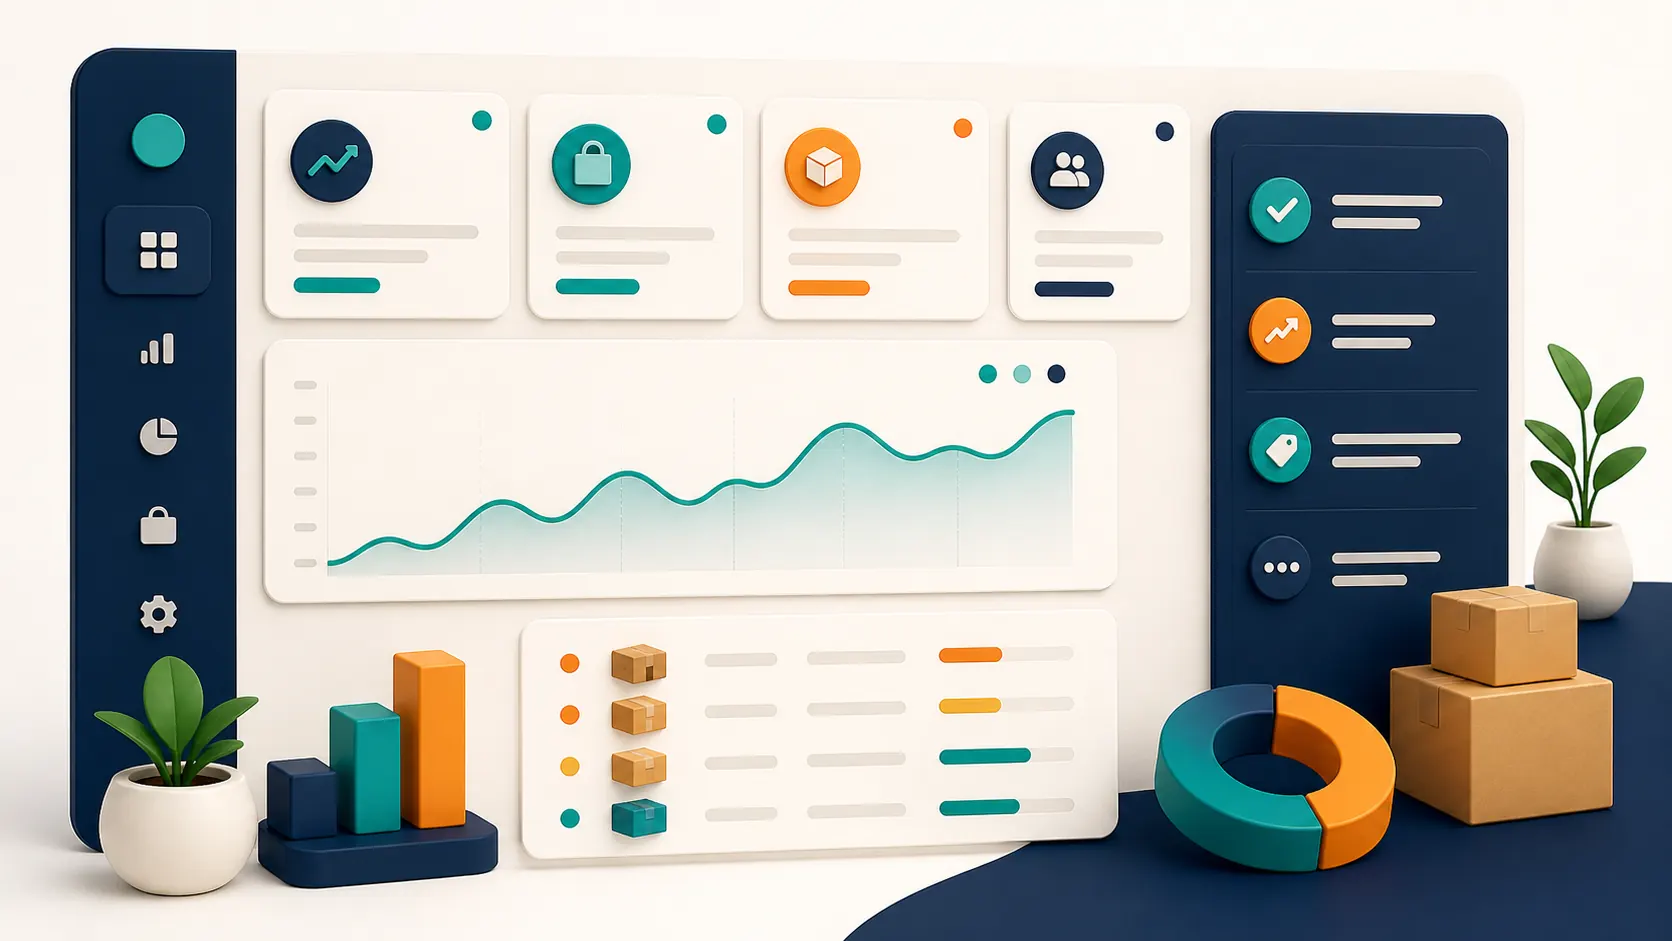
Review the output against the source files before sharing it or acting on it.
Always review results before sharing or acting on them. Check totals against the source files, inspect how missing values were handled, and make sure the labels and filters match the question you asked.
Frequently asked questions
What is the easiest way to start with small business data analytics?
Choose one recurring decision, export the related data into a spreadsheet, and calculate a small set of metrics that directly supports that decision. A weekly sales and inventory review is often a practical starting point.
Do small businesses need a data analyst?
Not to begin. Many useful analyses can be completed by the people closest to sales, operations, or customers when they have clear definitions and a repeatable workflow. As data volume and complexity grow, specialist support may become valuable.
Which analytics tools are best for small businesses?
The best tool depends on your data sources, reporting frequency, collaboration needs, and technical capacity. Start with the tools your team can use consistently. Spreadsheet-first workflows are often a practical option for ad hoc analysis and recurring reports.
How often should a small business review data?
Review the cadence of the decision. Sales and inventory may need weekly review; marketing performance may be reviewed weekly or monthly; strategic metrics may be reviewed monthly or quarterly. Use the same definitions each time so changes are meaningful.
Start small, then make it repeatable
Small business data analytics works best when it becomes a habit: ask one clear question, use reliable data, create a compact analysis, take one action, and review the result. You do not need to build an enterprise analytics program on day one.
Start with the spreadsheet your team already uses. Turn it into a repeatable view of sales, customers, inventory, or operations - then improve the workflow as the business grows.
Ready to turn a business spreadsheet into a clearer analysis? Analyze your small business data with AI Sheets.