Direct answer
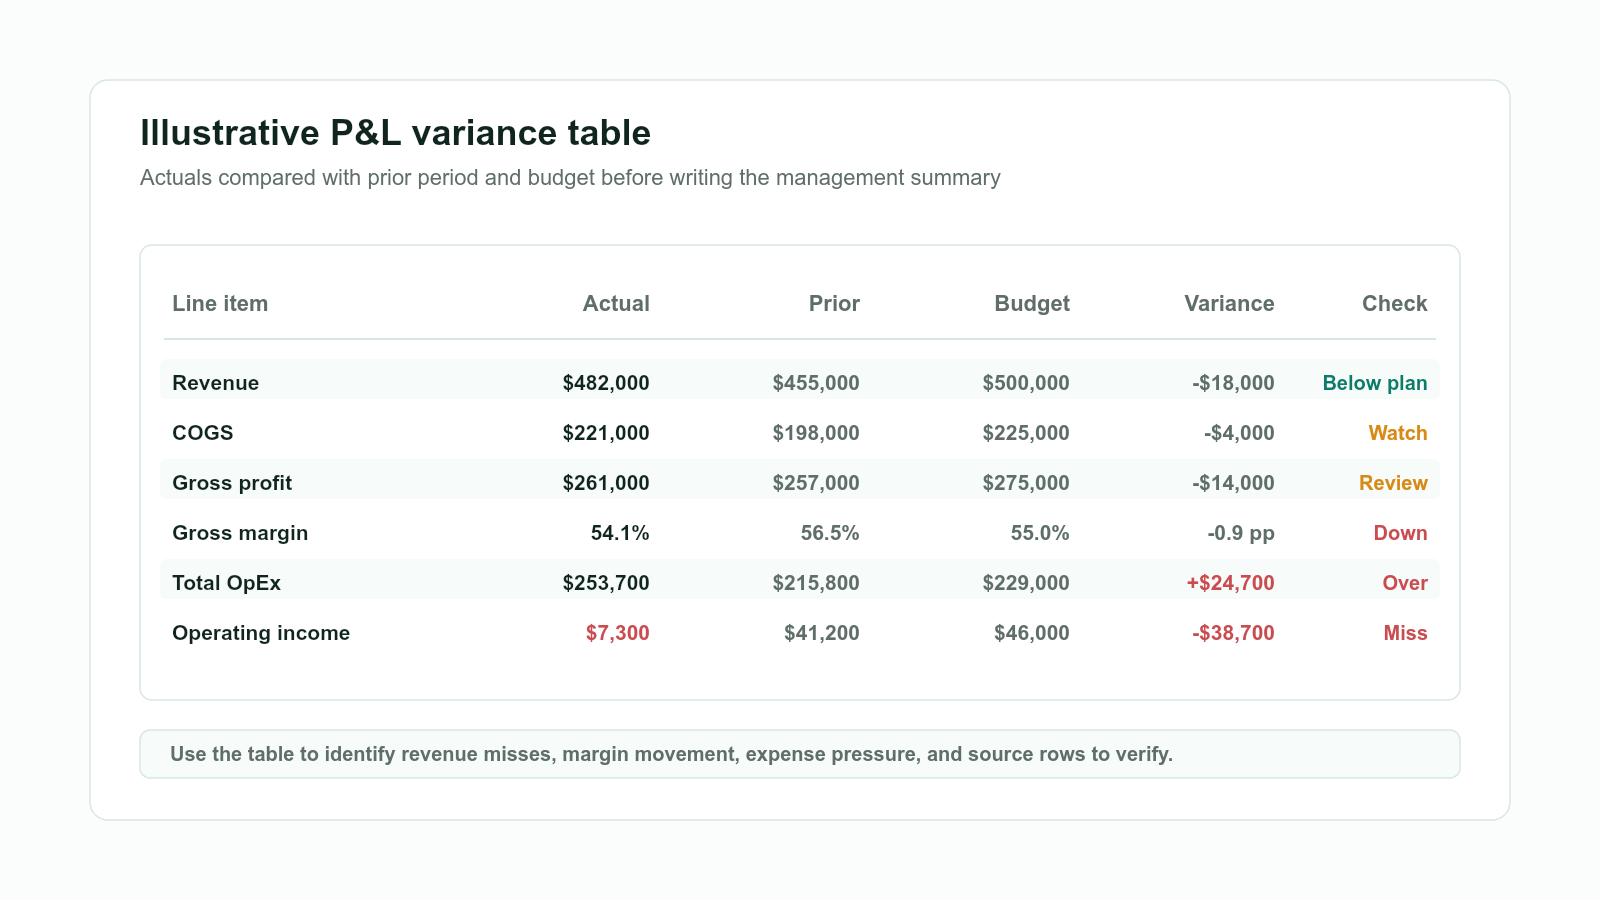
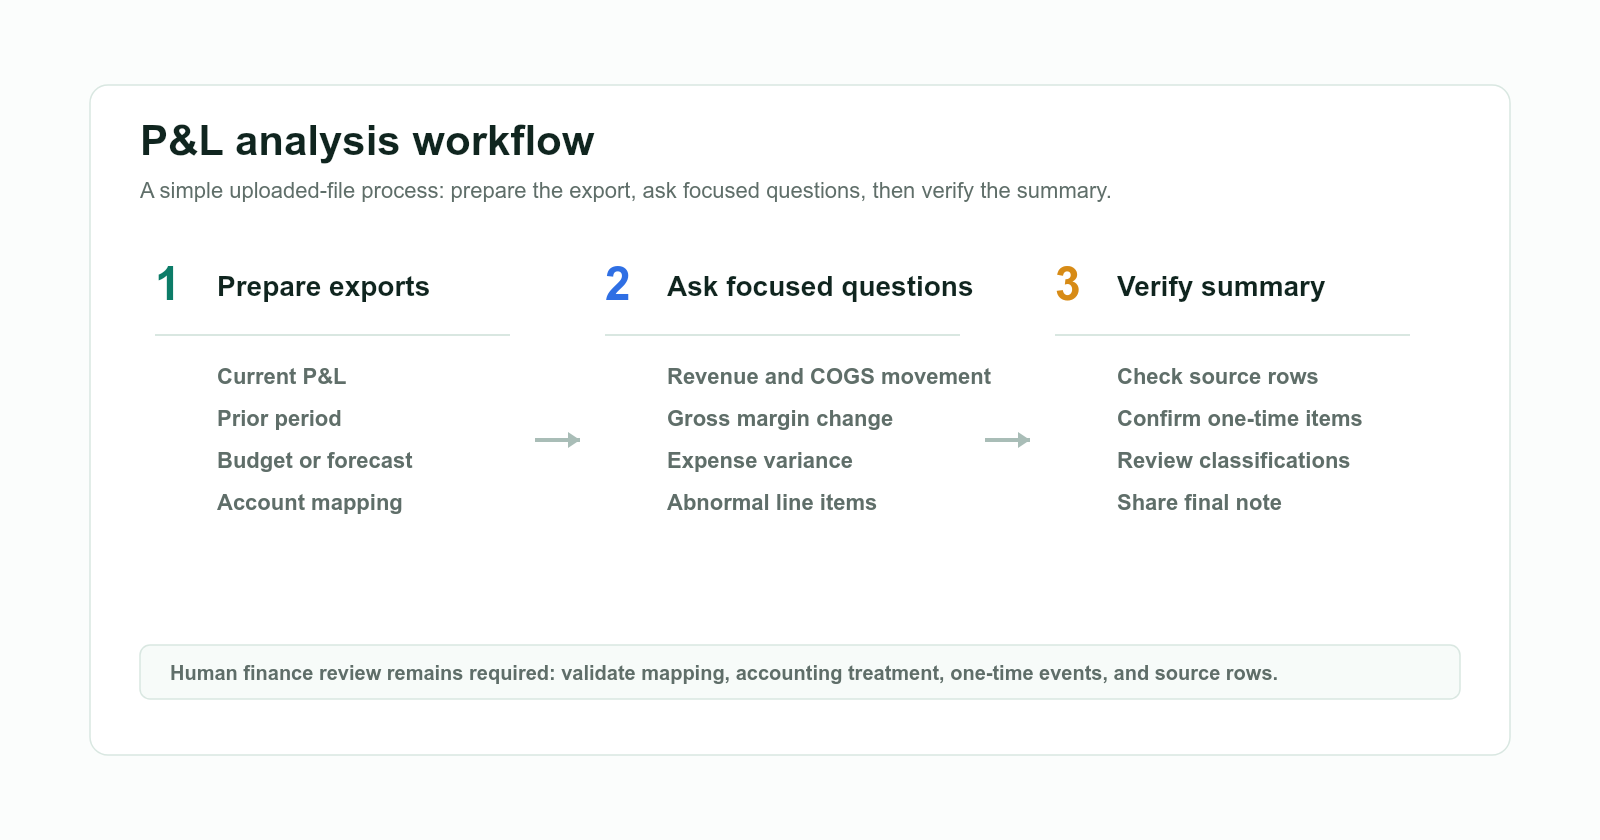
To analyze a profit and loss statement in Excel with AI, start with a clean P&L export, give the AI enough context to understand the period and comparison point, then ask it to explain revenue, COGS, gross profit, operating expenses, unusual changes, and the management takeaway. The goal is not to let AI "do finance" by itself. The goal is to make the first review faster, clearer, and easier to trace back to the spreadsheet.
For most teams, the useful output is a short management summary: what changed, what mattered, why it might have happened, and what finance should check next.
What a P&L analysis should actually answer
A profit and loss statement tells you whether the business made money during a period, but the total profit number is rarely enough. A good review explains the shape of the result. Did revenue grow because volume improved, pricing changed, or a one-time customer payment landed? Did COGS rise faster than revenue? Did a software renewal, payroll change, campaign, or reclassification push expenses above plan?
That is why the P&L is closely related to budget forecasting. The P&L tells you what happened. The budget or forecast tells you whether that result was expected. AI is most useful when it can look at both: the current P&L and the comparison point.
Before using AI, gather the current P&L, the prior period P&L, and the budget or forecast for the same period. If you have an account mapping file, include it. If you know a large invoice, annual renewal, or accounting reclass happened during the period, add that note too. Small bits of context prevent AI from writing a confident but unsupported explanation.
Clean the spreadsheet before asking for analysis
Most weak AI summaries start with messy input. If the Excel file has merged headers, blank rows, subtotals mixed with account rows, or account names that change from one month to the next, the AI may still produce an answer, but the answer will be harder to trust.
A cleaner workbook usually has one row per account or reporting line, one column for the current period, one column for the prior period, and one column for budget. It should be obvious which rows belong to revenue, COGS, operating expenses, and other income or expense. If that grouping is not obvious, create a simple "Account group" column before you analyze.
For example, product revenue and service revenue belong in revenue. Direct delivery costs, hosting tied to delivery, payment processing, materials, or direct labor usually belong in COGS. Sales and marketing, payroll, software, rent, and general administrative costs usually sit in operating expenses. The exact classification depends on your accounting policy, so AI should help review the structure, not invent the policy.
Ask AI for the business story, not just formulas
The basic formulas are simple: gross profit is revenue minus COGS, gross margin is gross profit divided by revenue, and operating income is gross profit minus operating expenses. The more valuable work is explaining what moved those numbers.
Ask AI to compare actuals against both the prior period and budget. Prior-period comparison tells you what changed. Budget comparison tells you whether the change was expected. Dollar variance shows whether the movement is material; percentage variance shows how sharp the movement is.
You should also define what counts as abnormal before the review starts. A practical rule is to flag any line that changed by more than $5,000, more than 10%, or more than two percentage points for a margin line. Those thresholds are only examples. A smaller company may need lower thresholds, while a larger company may need higher ones.
The most important instruction is this: do not let AI invent the cause. If software expense increased, the model can say the increase is visible and worth checking. It should not claim the cause was a new tool rollout unless that information exists in the workbook or notes.
Example: AI-assisted P&L analysis in Excel
The example below is illustrative sample data. It is not customer data, benchmark data, or a public financial claim.
| Line item | Aug 2026 actual | Jul 2026 actual | Budget | Actual vs budget |
|---|---|---|---|---|
| Revenue | $482,000 | $455,000 | $500,000 | -$18,000 |
| COGS | $221,000 | $198,000 | $225,000 | -$4,000 |
| Gross profit | $261,000 | $257,000 | $275,000 | -$14,000 |
| Gross margin | 54.1% | 56.5% | 55.0% | -0.9 pp |
| Sales and marketing | $78,000 | $64,000 | $70,000 | +$8,000 |
| Payroll | $112,500 | $110,000 | $112,000 | +$500 |
| Software | $29,500 | $19,000 | $21,000 | +$8,500 |
| G&A | $33,700 | $22,800 | $26,000 | +$7,700 |
| Total OpEx | $253,700 | $215,800 | $229,000 | +$24,700 |
| Operating income | $7,300 | $41,200 | $46,000 | -$38,700 |
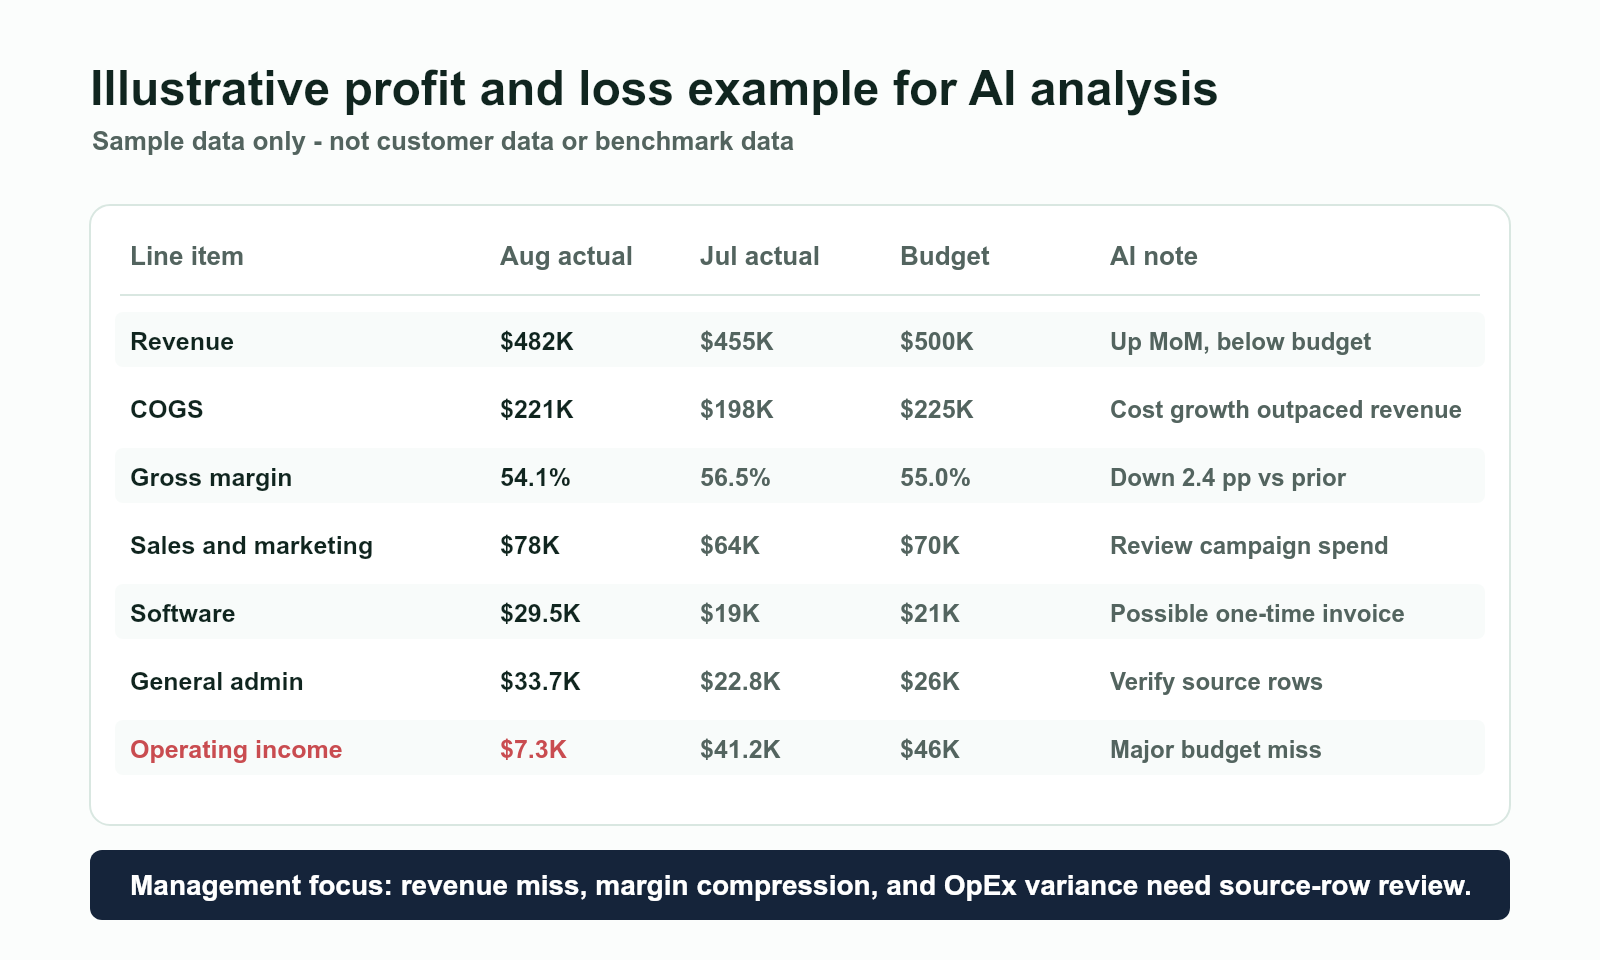
A useful AI summary would not simply repeat the table. It would say that revenue increased 5.9% from July to August, but still finished $18,000 below budget. It would point out that gross margin declined from 56.5% to 54.1%, which means direct costs grew faster than revenue. It would also notice that operating expenses were $24,700 above budget, with the biggest pressure coming from sales and marketing, software, and G&A.
The management summary might read:
August revenue was $482,000, up from July but below the $500,000 budget. Gross margin fell to 54.1% as COGS increased faster than revenue. Operating expenses were above budget, mainly from sales and marketing, software, and G&A. Operating income was $7,300 versus a $46,000 budget. Finance should check whether the software and G&A increases are one-time items and confirm that COGS accounts were mapped consistently.
That is the kind of answer worth keeping. It gives the direction, the size of the issue, and the follow-up work. It does not pretend to know facts that are not in the file.
Prompts to use in AI Sheets
If you use hiData AI Sheets, upload the P&L export, prior period export, budget file, and account mapping file if available. Then ask narrow questions instead of asking for a vague review.
Analyze this P&L. Explain revenue, COGS, gross profit, operating expenses,
abnormal changes, and write a management summary for August 2026.
Compare August actuals to July actuals and budget. Show the dollar variance,
percentage variance, and the likely driver. Do not assume causes that are not
visible in the uploaded files.
Flag any line where the variance is above $5,000 or 10%. For each flagged item,
show the account name or source row finance should verify.
This is the right product fit for hiData: AI Sheets helps teams work with uploaded Excel or CSV files and ask spreadsheet questions in plain English. This article does not claim direct database, ERP, accounting-system, GL, or bank connection.
The broader hiData finance use case is about turning scattered finance files into cleaner tables, analysis, and shareable outputs. For this P&L workflow, that means moving from exports and manual review toward a clearer variance narrative.
Write the management summary like a finance note
The best summary is short, but it should not be vague. It needs a clear opening result, two or three drivers, and a practical follow-up. If everything sounds equally important, nothing is important.
| Summary section | What to include |
|---|---|
| Overall result | Revenue, gross margin, OpEx, and operating income in plain language |
| Main driver | The largest revenue, COGS, or expense movement |
| Budget context | Whether actuals beat or missed plan |
| Risk or caveat | One-time items, mapping issues, or missing context |
| Follow-up | Source rows, invoices, or account classifications to verify |
A strong summary might be only five sentences long. It should read like something a finance manager could paste into a monthly business review after checking the source rows. It should not sound like an automated report trying to mention every line item.
Common mistakes to avoid
The first mistake is mixing cash timing with accrual P&L results. A cash receipt is not always revenue, and a vendor payment is not always the expense period. If the workbook mixes cash and accrual views, label them clearly before asking for analysis.
The second mistake is using percentage variance by itself. A 200% increase on a tiny account may matter less than a 6% revenue miss. Ask for both dollar variance and percentage variance so the summary does not chase noise.
The third mistake is accepting an explanation that cannot be traced. If the AI says an expense rose because of a renewal, ask where that renewal appears in the uploaded data. If it cannot point to a row, treat the explanation as a hypothesis, not a conclusion.
The final mistake is using AI to make the article or report sound more certain than the data allows. A good P&L review often ends with "check this invoice," "confirm this mapping," or "ask the owner of this budget line." That is not a weakness. That is finance discipline.
FAQ
Can AI analyze a profit and loss statement in Excel?
Yes. AI can calculate margins, compare periods, flag unusual changes, and draft a management summary from a structured Excel P&L. The finance owner should still verify account mapping and source rows.
What files should I upload for AI P&L analysis?
Use the current P&L, prior period P&L, budget or forecast, and an account mapping file if available. Notes about one-time events also help.
What should a P&L management summary include?
It should summarize revenue, COGS, gross profit, operating expenses, major abnormal changes, and the actions finance should take next.
Can hiData connect directly to my accounting database?
This article does not claim database or ERP direct connection. The workflow described here uses uploaded Excel or CSV exports in hiData AI Sheets.
Is AI analysis enough for audit, tax, or accounting sign-off?
No. AI can speed up analysis and drafting, but finance, accounting, audit, and tax decisions need qualified human review.
Build your P&L review in hiData
Upload your Excel or CSV exports, ask plain-English questions, and turn variance analysis into a management-ready summary.