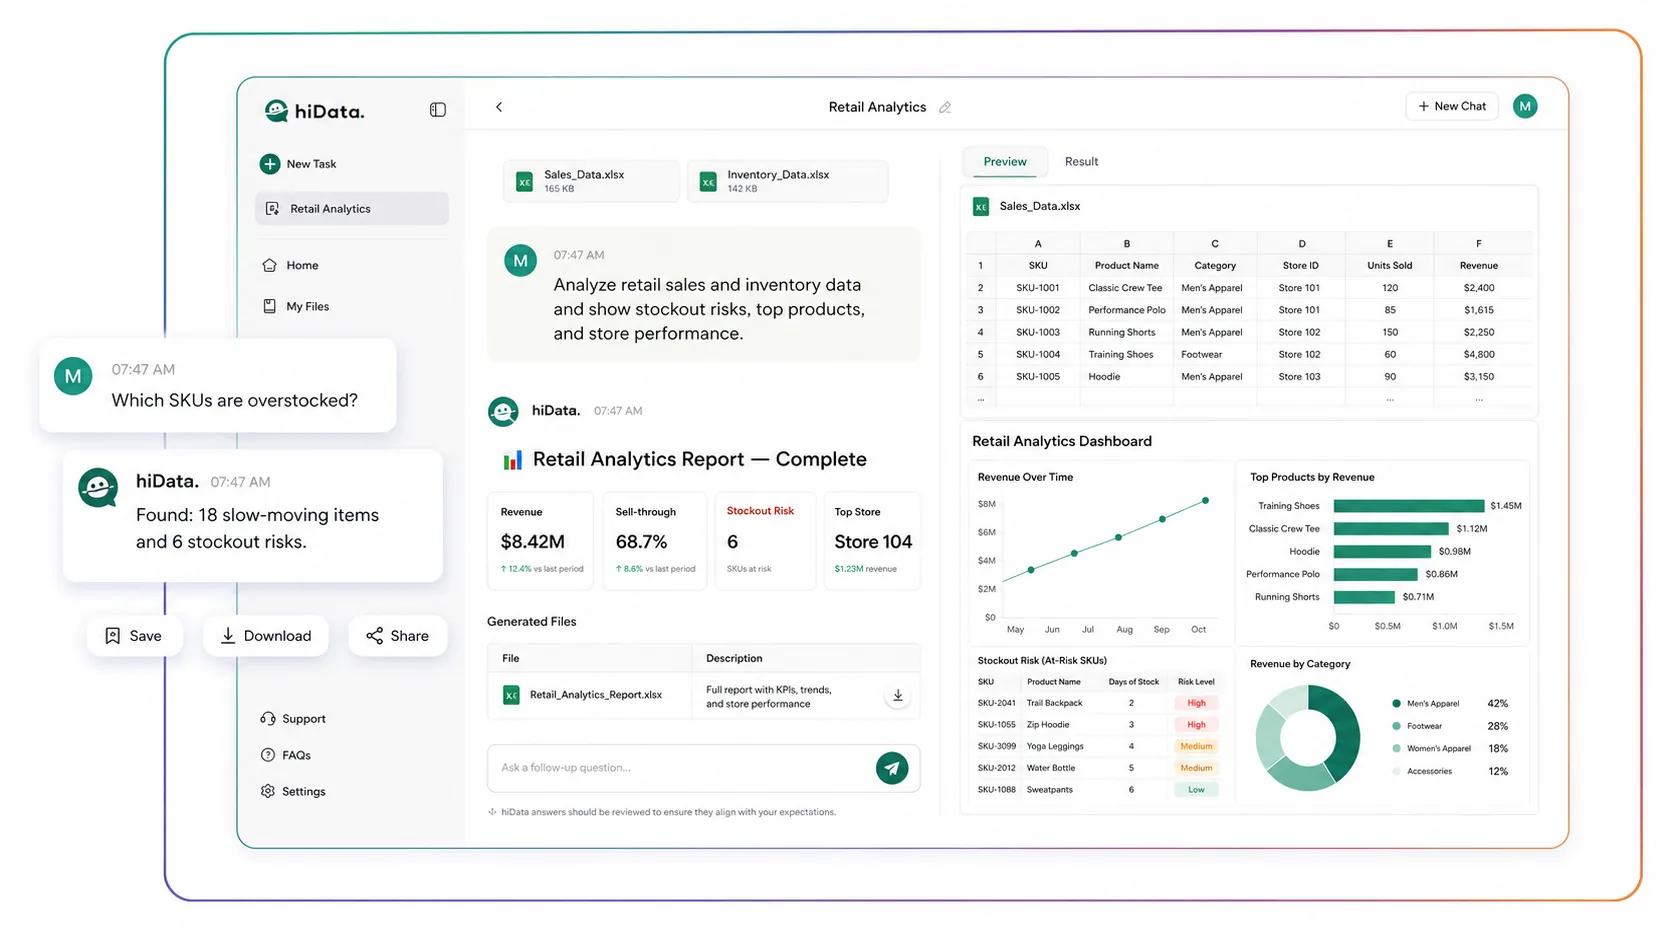
Every sale, return, restock, and promotion leaves a signal behind.
Retail analytics helps retailers turn those signals into better decisions. Instead of relying only on instinct, teams can use sales, inventory, customer, product, and store data to understand what is working, what is changing, and where action is needed.
For small and midsize retailers, this does not have to begin with a large enterprise BI project. It can start with the files teams already use every day: POS exports, Excel workbooks, CSV reports, e-commerce orders, inventory sheets, and store performance data.
What is retail analytics?
Retail analytics is the process of collecting, organizing, analyzing, and interpreting retail data to improve business decisions.
It helps retailers answer questions such as:
- Which products are driving revenue and margin?
- Which SKUs are overstocked or close to stockout?
- Which stores or channels are underperforming?
- Which promotions actually improved sales?
- Which customers are buying repeatedly?
- What demand should we expect next month?
The goal is not just to create reports. The goal is to turn retail data into decisions that improve sales, inventory, operations, and customer experience.
Why retail analytics matters
Retailers often have more data than they can use. The challenge is making that data clear enough to act on.
Spot what is really driving sales
Revenue alone does not tell the whole story. Retail analytics helps teams see which products, categories, stores, and channels are contributing to growth, and which ones are quietly hurting margin.
Optimize inventory before problems grow
Too much stock ties up cash. Too little stock creates missed sales. By tracking sell-through rate, inventory turnover, stock on hand, and days on hand, retailers can make smarter reorder and markdown decisions.
Understand customer behavior
Retail analytics can reveal repeat purchase patterns, average order value, product preferences, loyalty behavior, and segment-level trends. This helps teams create more relevant campaigns and better customer experiences.
Compare store and channel performance
For retailers selling across multiple stores, e-commerce channels, or marketplaces, analytics helps identify whether a problem is business-wide or isolated to a specific location, product group, or channel.
Move faster with better evidence
Retail conditions change quickly. Analytics gives teams a clearer way to respond to demand shifts, seasonal changes, promotion results, and operational issues before they become expensive.
Types of retail analytics
Retail analytics usually falls into four categories.
Descriptive analytics
Descriptive analytics shows what happened.
Examples include monthly sales, top-selling products, revenue by store, inventory on hand, and average order value.
Diagnostic analytics
Diagnostic analytics explains why something happened.
Examples include investigating why margin dropped, why one store underperformed, why returns increased, or why a product sold out faster than expected.
Predictive analytics
Predictive analytics estimates what may happen next.
Retailers can use it for demand forecasting, seasonal planning, stockout risk, and sales projections.
Prescriptive analytics
Prescriptive analytics recommends what action to take.
Examples include reordering specific SKUs, reducing discounts on high-demand products, moving stock between stores, or reviewing a campaign that did not perform as expected.
Retail analytics use cases
Sales performance analysis
Retailers can track revenue, units sold, gross margin, average order value, and sales trends across time periods, stores, products, and channels.
This helps teams understand whether sales growth is healthy or whether it depends too heavily on discounts, one product category, or one location.
Inventory risk analysis
By combining sales and inventory data, retailers can identify slow-moving products, overstocked SKUs, low-stock items, and products at risk of stockout.
This is one of the fastest ways retail analytics can improve cash flow.
Product and merchandising analysis
Retail analytics helps teams compare product performance by category, margin, sell-through rate, return rate, and promotion response.
This supports better shelf planning, assortment decisions, bundling, and markdown strategy.
Store and channel comparison
Retailers can compare performance across stores, regions, e-commerce channels, and marketplaces.
This helps answer whether a sales issue is caused by product mix, local demand, inventory availability, pricing, or store execution.
Promotion analysis
Promotions can lift sales while reducing margin. Retail analytics helps teams compare pre-promotion, during-promotion, and post-promotion performance to see whether the campaign actually created value.
Demand forecasting
Retailers can use historical sales, seasonality, recent trends, and promotion data to estimate future demand.
Better forecasting helps teams plan inventory, staffing, purchasing, and cash flow with more confidence.
Retail data analytics best practices
Start with a clear business question
Do not begin with every metric. Begin with a decision.
For example:
- What should we reorder this week?
- Which products should we discount?
- Which store needs attention?
- Which category is losing margin?
- Which SKUs are likely to run out?
Use the data you already have
Most SMB retailers can start with POS exports, inventory sheets, product files, e-commerce reports, customer lists, and promotion records.
The first step is not connecting every system. The first step is making useful data clean, readable, and actionable.
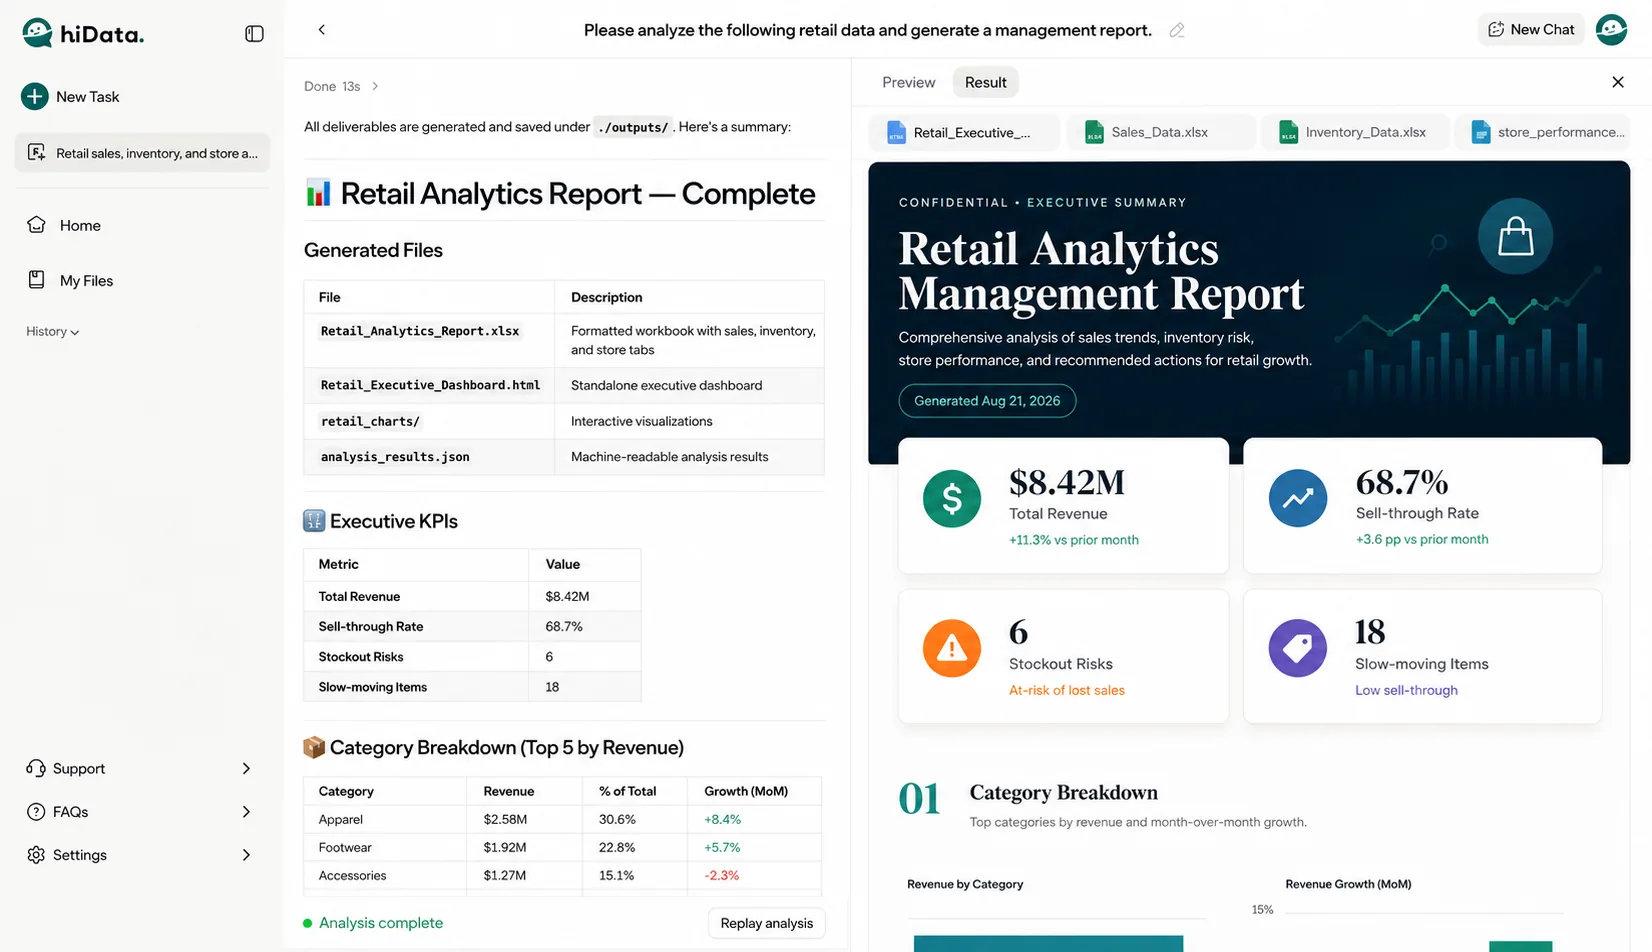
Keep the dashboard simple
A good retail analytics dashboard should focus on the metrics that drive action: revenue, margin, units sold, sell-through rate, inventory turnover, stockout risk, return rate, and store or channel performance.
Review exceptions, not just averages
Averages can hide problems. Retail teams should look for unusual drops, slow-moving items, sudden return spikes, margin changes, and store-level differences.
Turn insights into action
The value of analytics is not the chart. It is the decision that follows.
Each review should end with a next step: reorder, discount, investigate, transfer stock, adjust a campaign, or update the forecast.
Conclusion
Retail analytics gives retailers a clearer way to understand what is happening across sales, inventory, products, customers, stores, and channels.
For small and midsize retailers, the opportunity is not only in collecting more data. It is in using the data they already have to make better decisions faster: what to reorder, what to discount, which products to promote, which stores need attention, and where demand may shift next.
A strong retail analytics workflow helps teams move from scattered reports to practical insight, and from practical insight to action.
hiData AI Sheets helps retail teams analyze the files they already have, including Excel workbooks, CSV exports, POS reports, sales data, and inventory sheets. Instead of manually rebuilding formulas and pivot tables, teams can ask questions in plain English, generate dashboards, identify trends, and turn retail data into clearer next steps.
Use your retail data to make smarter decisions faster with hiData AI Sheets - Start for free.