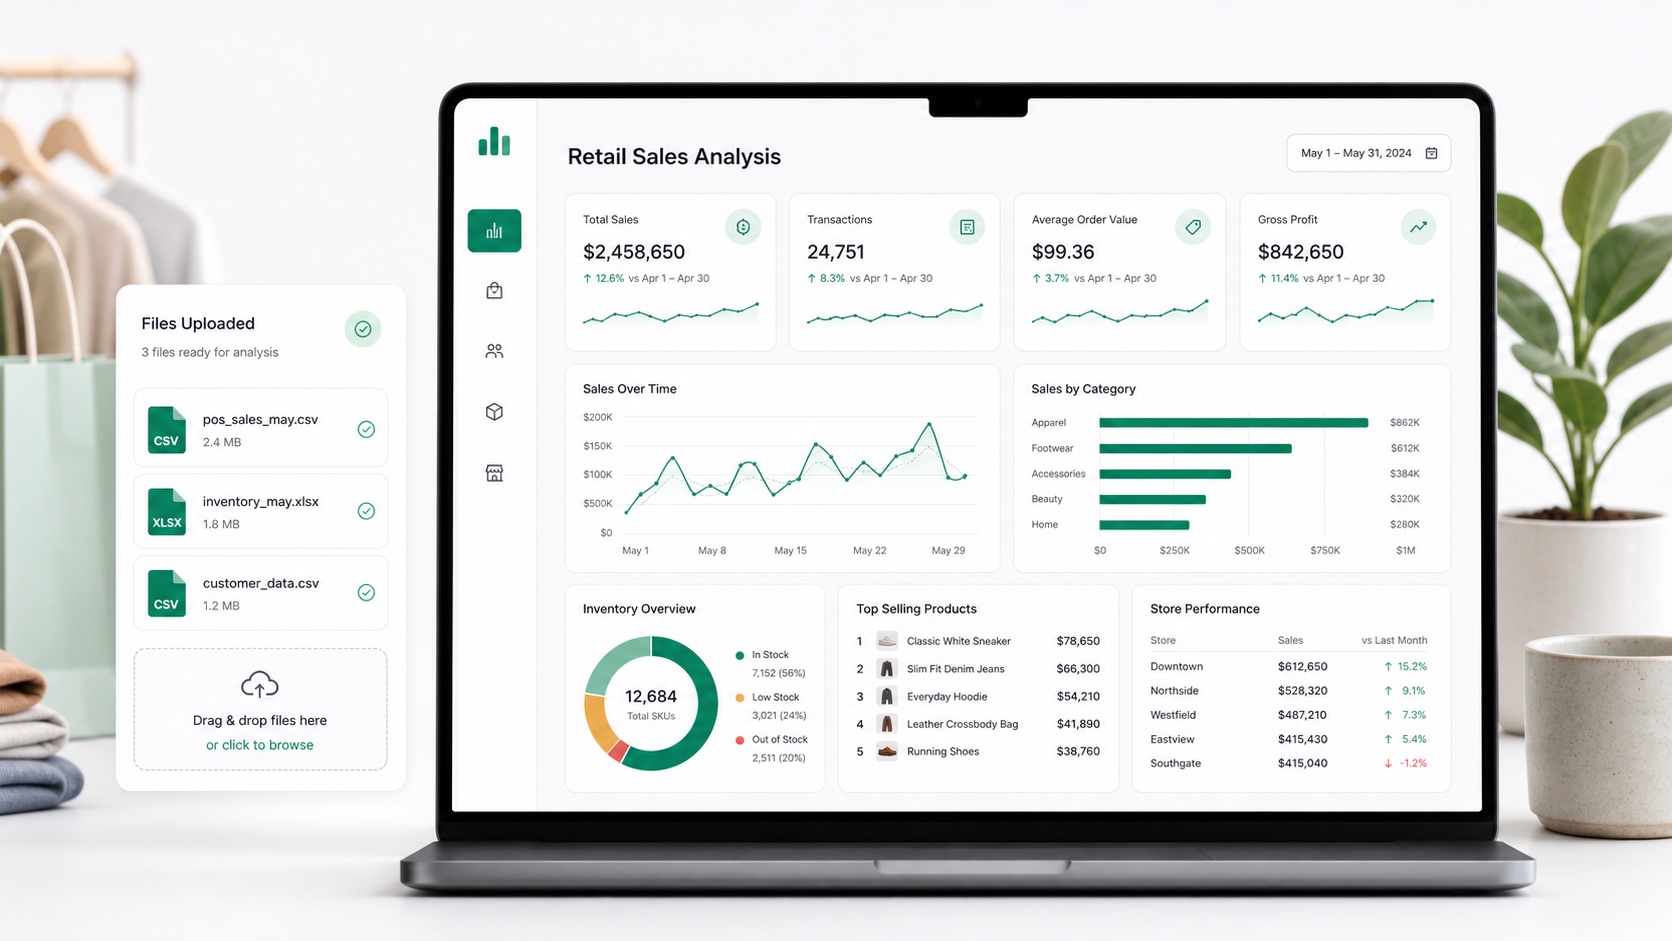
You are in the store before opening. Yesterday's sales report is in one file. Inventory is in another. A manager has notes about a promotion that worked in one location but not another.
None of the data is useless. It is just scattered.
Retail analytics is the work of turning those scattered sales, inventory, customer, and store files into decisions a retail team can act on. For a small or midsize business, that may mean knowing what to reorder, what to discount, which store needs help, or which product may run out next week.
This guide explains what it means, which data to start with, what metrics matter, and how a file-based AI workflow can help teams move from spreadsheets to dashboards, forecasts, and next steps.
What is retail analytics?
Retail analytics is the process of using retail data to understand business performance and decide what to do next. It can cover sales, inventory, pricing, promotions, customers, stores, and online channels.
In enterprise companies, this may involve large BI teams and connected data warehouses. In an SMB, it often starts in a much simpler place: exported POS reports, Excel files, CSV files, and a few urgent questions from the owner or operations team.
The first goal is not a perfect data system. The first goal is a decision you can make with more confidence.
Why it matters for SMB retailers
Retail problems rarely arrive with clean labels.
A slow week may be a demand problem, a stock problem, a pricing problem, or a store execution problem. A bestseller may look healthy until you notice that margin is thin. A promotion may increase revenue while quietly creating too many returns.
Good analysis helps a team separate the signal from the noise.
It can answer questions like:
- Which products are selling, and which ones are tying up cash?
- Which SKUs are likely to run out before the next order cycle?
- Which store or channel is underperforming?
- Did a promotion improve margin, or only increase units sold?
- What demand should we expect next month?
- Which customers are coming back?
For small teams, the biggest value is speed. You do not need to wait for a monthly report if the files already exist. You can review the data, find the issue, and adjust buying, pricing, or staffing sooner.
What data should you start with?
Start with the data that is closest to daily decisions. It should be easy to export and easy for the team to explain.
| Data source | Common fields | Questions it helps answer |
|---|---|---|
| POS sales exports | date, SKU, quantity, revenue, discount, store | What sold, where, and when? |
| Inventory files | SKU, current stock, safety stock, reorder point, category | What is low, overstocked, or at risk? |
| Product data | SKU, product name, category, cost, margin | Which products are profitable? |
| Customer files | customer ID, order history, frequency, average order value | Who buys again, and what do they prefer? |
| Channel reports | store, e-commerce, marketplace, returns | Is performance different by channel? |
Sales data is usually the easiest starting point. Most retailers already export it from a POS system, e-commerce platform, or spreadsheet.
Inventory data should come next. It helps reveal stockouts, slow-moving products, and cash trapped in products that are not selling fast enough.
The four types of retail analysis
Most teams do not need complicated terminology. Still, the four common analysis types are useful because they show how reporting becomes action.
| Type | Plain-English question | Retail example |
|---|---|---|
| Descriptive analysis | What happened? | Revenue by week, top products, sales by store |
| Diagnostic analysis | Why did it happen? | A category dropped because several SKUs were out of stock |
| Predictive analysis | What might happen next? | Demand may exceed available stock next month |
| Prescriptive analysis | What should we do? | Reorder these SKUs, reduce markdowns, or move stock between stores |
A dashboard may show that revenue fell last week. That is useful, but it is only the start.
The better question is why it fell. If the answer is a stock issue in one category, the next question is whether it will happen again. From there, the team can decide whether to reorder, transfer stock, change a promotion, or review the supplier.
Practical examples for retail teams
The strongest use cases begin with a real operating question. Here are five that fit SMB retailers well.
1. Best-selling product analysis
Rank products by revenue, units sold, gross margin, and sell-through rate.
This helps answer:
- Which products deserve more shelf space?
- Which products should be reordered first?
- Which high-volume products have weak margin?
- Which products should be bundled or promoted?
2. Slow-moving inventory review
Compare current stock, recent sales, days on hand, and sell-through rate.
This helps identify products that may need markdowns, bundling, or lower future purchasing. It also protects cash flow, which matters a lot for smaller retailers.
3. Retail sales analytics by store or channel
Compare revenue, units sold, average order value, returns, and margin across stores, regions, or channels.
This is useful when one location feels slow, but the reason is not obvious. The problem may be product mix, staffing, stock availability, or a local promotion that did not work.
4. Promotion performance review
Compare sales before, during, and after a campaign.
Look beyond revenue. A promotion that raises sales but lowers margin may not be worth repeating. A smaller campaign that improves repeat purchase may be more valuable.
5. Demand forecasting
Use historical sales, seasonality, and recent trends to estimate future demand.
Retail forecasting does not have to be perfect to help. Even a directional forecast can support better buying, staffing, and cash-flow planning.
Metrics worth tracking
Do not start with 50 metrics. Start with the numbers that change a decision.
| Metric | What it tells you | Possible action |
|---|---|---|
| Total revenue | Overall sales performance | Compare by week, month, store, or channel |
| Gross margin | Whether sales are profitable | Review discounts, pricing, or product mix |
| Units sold | Product-level demand | Reorder, promote, or reduce purchasing |
| Average order value | Basket size | Test bundles or cross-sells |
| Sell-through rate | How quickly inventory sells | Increase reorder or reduce future buying |
| Days on hand | How long inventory may last | Flag overstock or stockout risk |
| Stockout risk | Where demand may be missed | Adjust reorder points |
| Return rate | Product quality or expectation issues | Review product descriptions or suppliers |
| Repeat purchase rate | Customer retention | Build loyalty or retention campaigns |
| Sales forecast | Expected future demand | Plan buying, staffing, and cash flow |
If a metric does not lead to a decision, it probably does not belong on the first dashboard.
For a full walkthrough of turning these metrics into a working dashboard, see the retail KPI dashboard guide.
A simple workflow for SMB retailers
Many teams can begin with exported files instead of a new data system.
Use this workflow:
- Export sales, inventory, and customer files from your POS, e-commerce, or accounting system.
- Check column names, dates, duplicate rows, and missing values.
- Join related files by SKU, store, date, or customer ID.
- Summarize results by product, category, store, and month.
- Build charts for top products, sales trends, and stock risk.
- Review exceptions, such as fast-selling low-stock items.
- Turn the findings into buying, pricing, promotion, or staffing actions.
For example, a store owner might ask:
- Which products had high revenue but declining unit sales?
- Which categories have high stock but low sell-through?
- Which store had the highest return rate last month?
- Which products may run out before the next purchase cycle?
This is the point where AI can save time: not by replacing judgment, but by reducing manual spreadsheet work.
For a closer look at how this plays out day to day, see how SMB retailers turn data into better decisions.
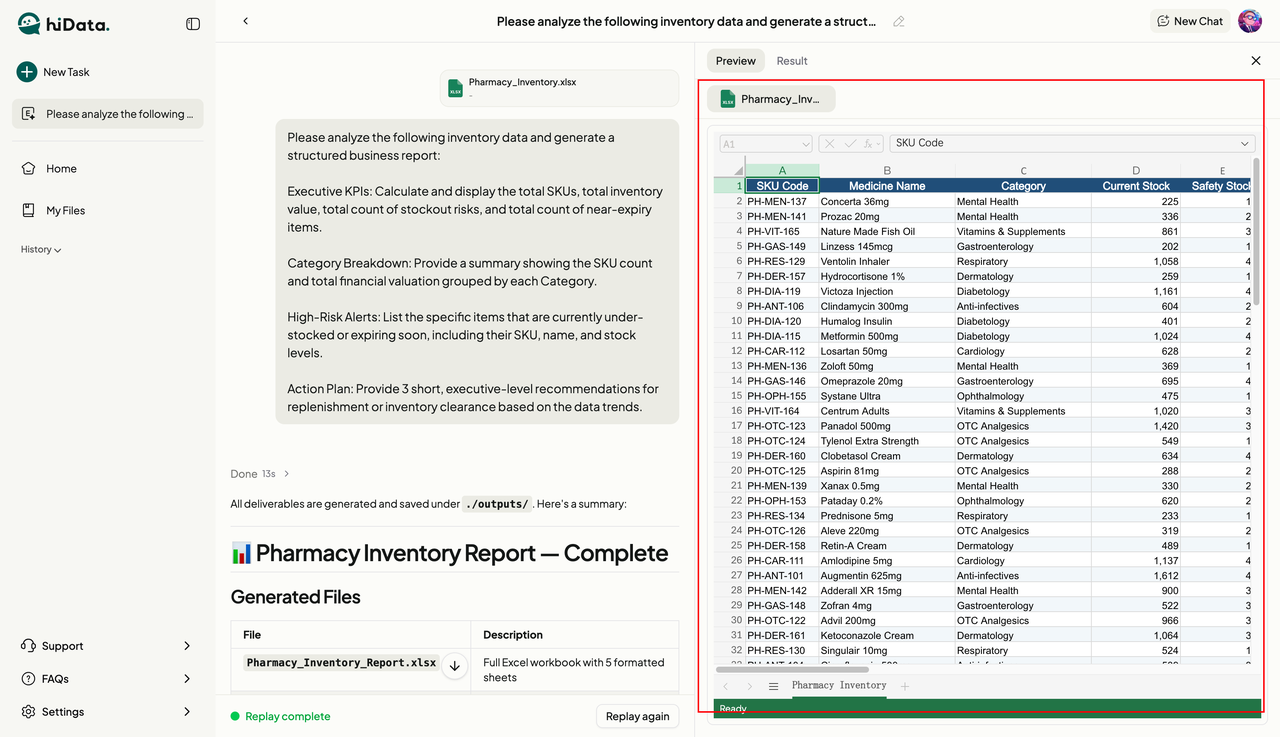
A raw inventory spreadsheet can be uploaded with a plain-English request for KPIs, risk alerts, and recommendations.
Turn files into dashboards and action plans
Traditional spreadsheet work often means formulas, pivot tables, cleanup, charts, and repeated formatting. That is hard when no one on the team owns analysis full time.
With hiData AI Sheets, teams can upload Excel, CSV, and structured business files, then ask questions in plain English. The output can include charts, summaries, reports, forecasts, and recommended next steps.
A file-based workflow can look like this:
| Upload | Ask | Output | Decision |
|---|---|---|---|
sales_may.csv |
What products drove revenue this month? | Product ranking and revenue chart | Reorder top products |
inventory.xlsx |
Which SKUs are overstocked or low? | Stock risk table | Reduce buying or replenish |
store_sales.csv |
Which store underperformed? | Store comparison dashboard | Review product mix |
promo_results.csv |
Did the campaign improve margin? | Before/after promotion report | Repeat, adjust, or stop |
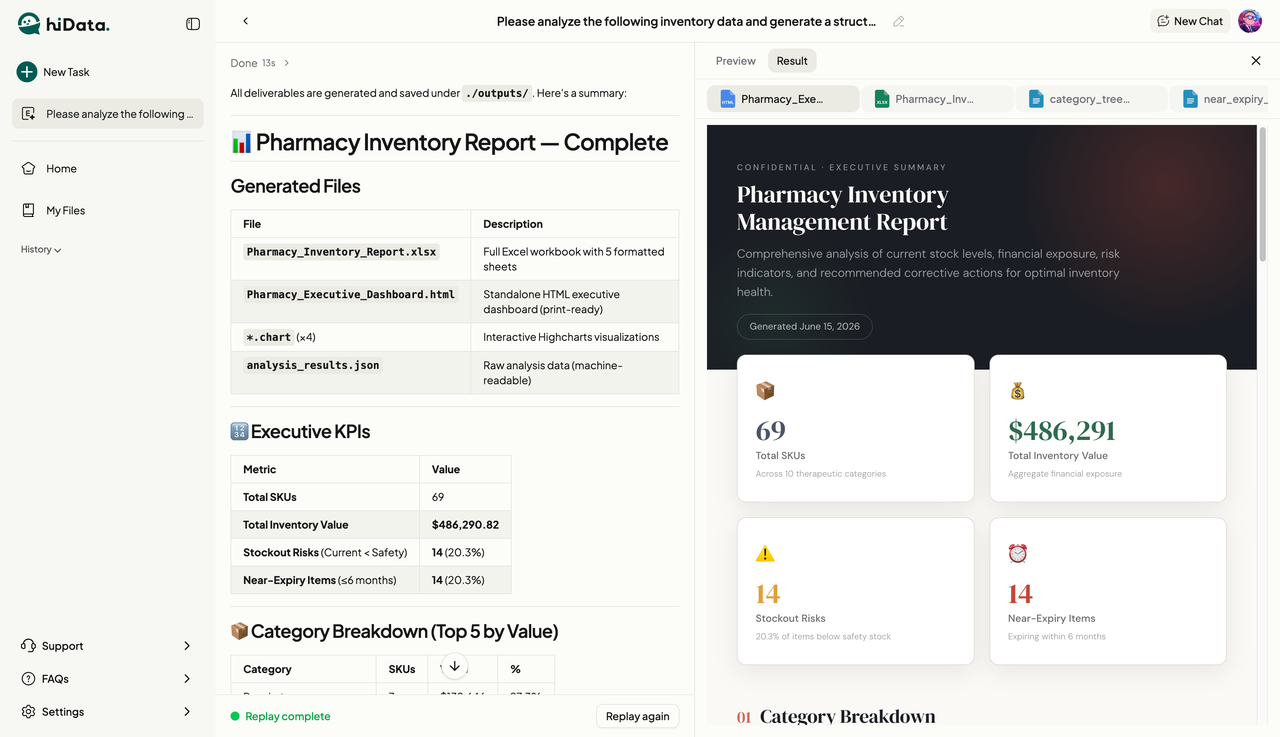
Example dashboard report generated from an uploaded inventory file.
One useful view is category concentration. If a large share of inventory value sits in only a few categories, the team can review whether that stock is moving fast enough.
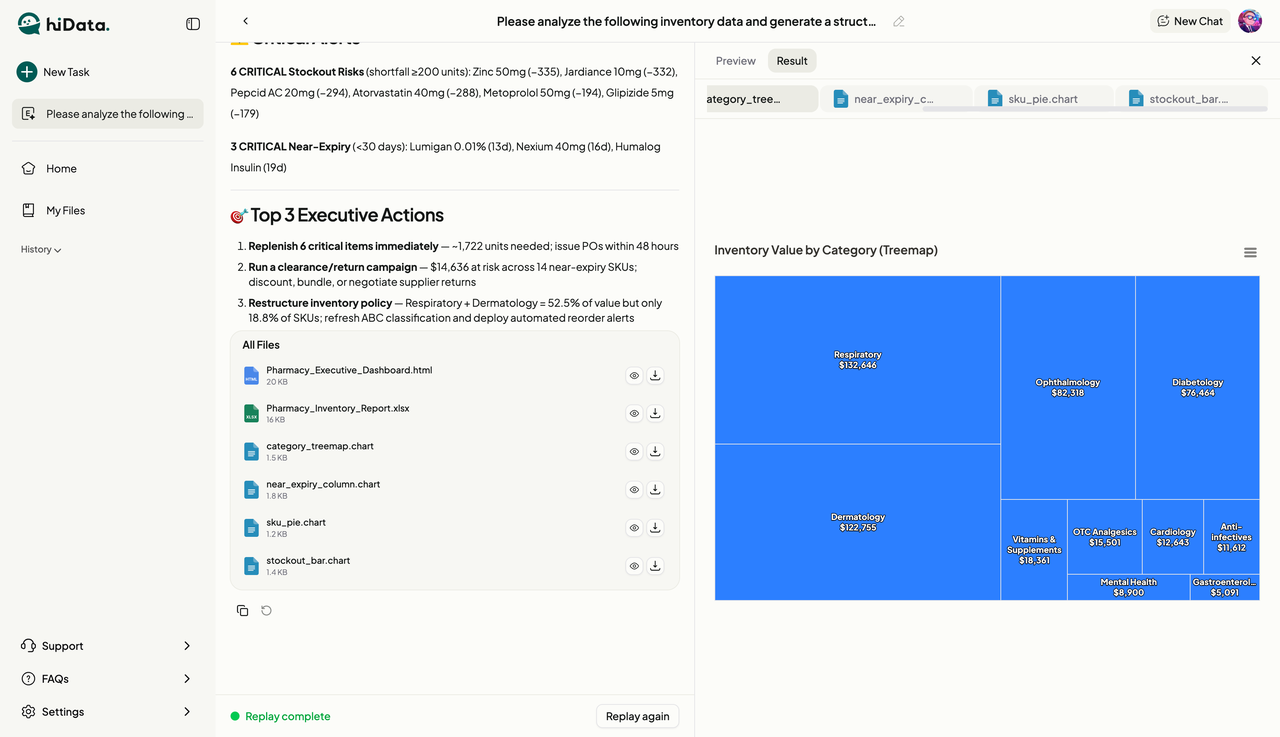
A category-level view helps retailers see where inventory value is concentrated.
The most helpful output is not always another chart. Retail teams often need to know what deserves attention first.
For an inventory workflow, that may include:
- Items below safety stock.
- Products close to expiration.
- Categories with too much capital tied up.
- Recommended actions for replenishment, markdowns, or review.
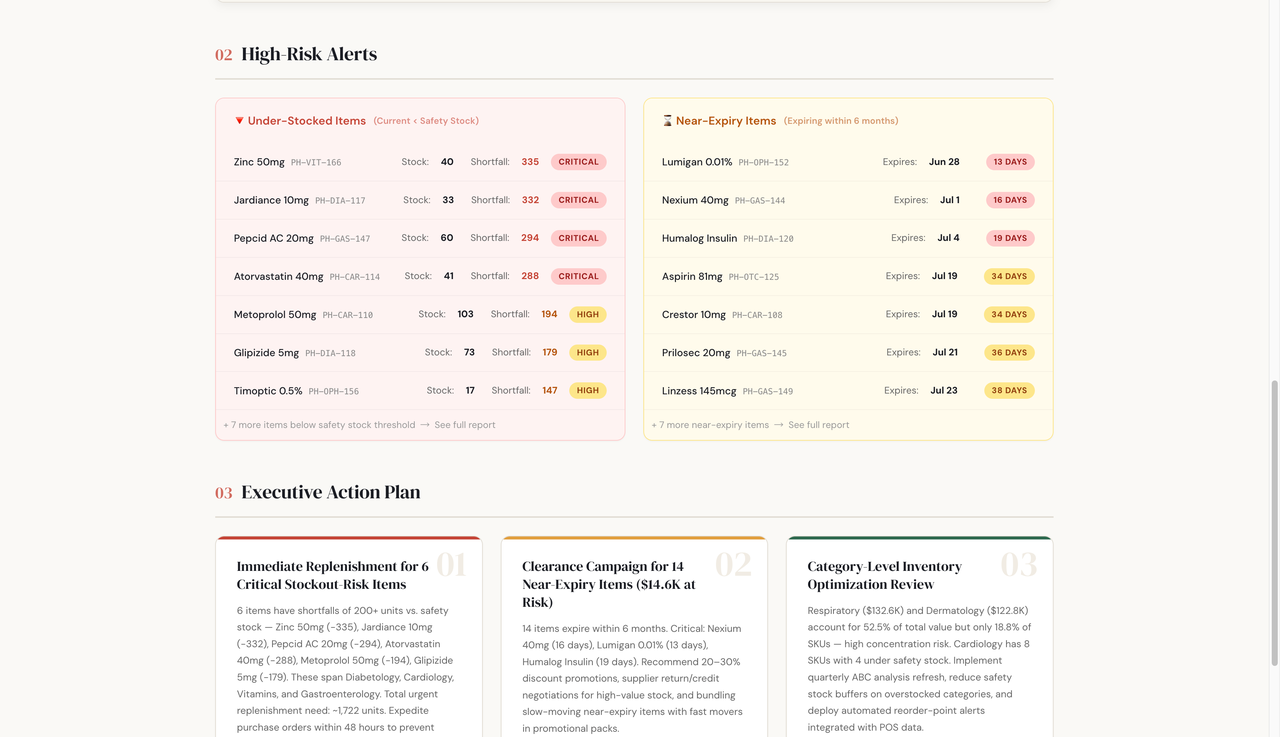
Risk alerts and recommendations help teams move from analysis to action.
When the work is complete, the output should be easy to share. A team may need a dashboard for review, an Excel workbook for operations, and charts for a weekly meeting.
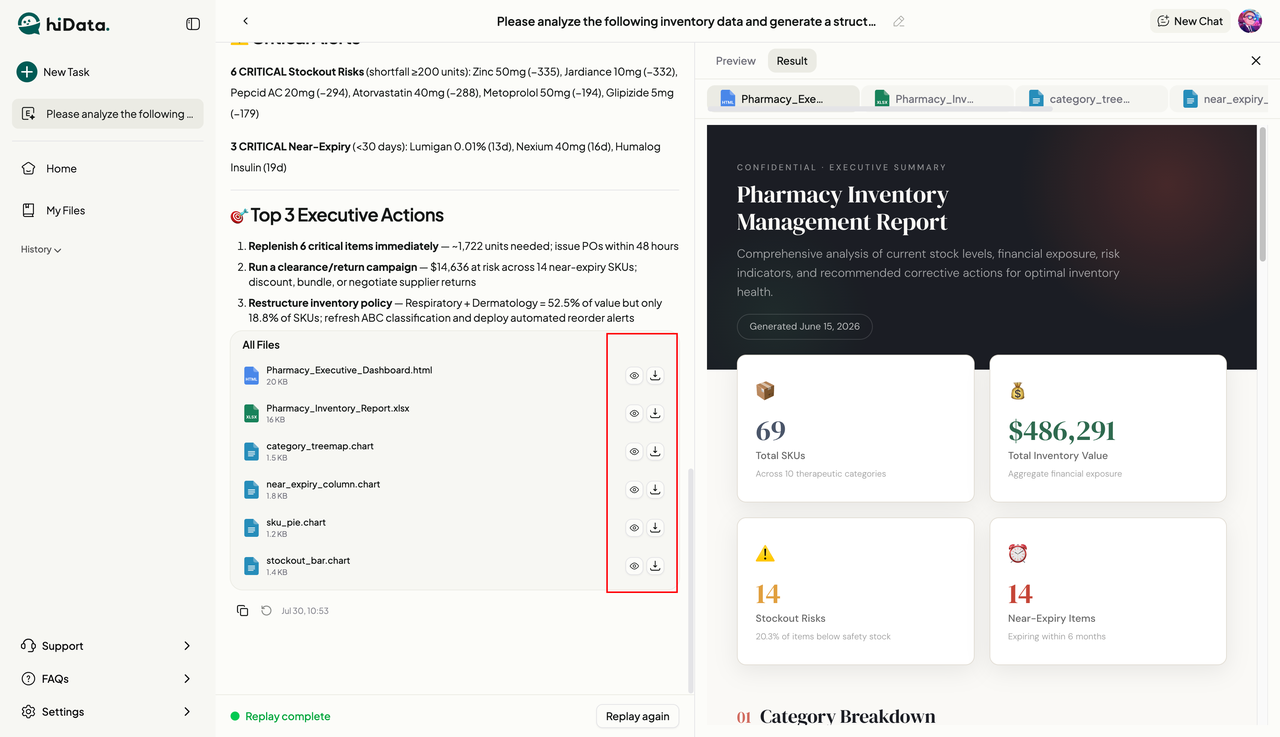
Generated reports, workbooks, and chart files can be previewed or downloaded for follow-up work.
This approach fits teams that already work with POS exports, e-commerce reports, and spreadsheets. It also avoids a heavy setup before the team knows which questions matter most.
Choosing a tool
The right retail analytics software should match how the team actually works.
For SMBs, useful questions include:
- Can it work with Excel, CSV, and POS exports?
- Can non-technical users ask questions in plain English?
- Can it clean inconsistent columns and messy files?
- Can it compare sales, inventory, store, and customer data?
- Can it create charts, dashboards, reports, and summaries?
- Can it support forecasting without heavy setup?
- Can it explain data limitations clearly?
- Can the team keep using it without engineering support?
If you are comparing spreadsheet-based AI options, this guide to the best Excel AI tools can help you evaluate what matters.
How to trust the numbers before acting
Good analysis still needs a human check. Before changing a buying plan, pricing decision, or staffing schedule, make sure the source files are reliable.
Review these points:
- The export includes the full time period you want to analyze.
- SKU, store, and date fields are consistent.
- Returns, discounts, and taxes are handled correctly.
- Forecasts are treated as estimates, not guarantees.
- Customer data follows privacy rules in your region.
These checks make the output more trustworthy. They also reduce the risk of acting on messy or incomplete data.
FAQ
What does this mean for retailers?
It means using retail data to understand sales, inventory, customers, stores, and operations. The purpose is to make better decisions, not just create reports.
What data is used?
Common data includes POS sales, e-commerce orders, inventory levels, product information, returns, customer purchase history, promotions, store performance, and channel reports.
What are common examples?
Common examples include best-selling product analysis, slow-moving inventory review, store performance comparison, promotion analysis, customer behavior analysis, and demand forecasting.
Can small businesses use it?
Yes. Small businesses can start with exported sales, inventory, and customer spreadsheets. They do not need to begin with a complex enterprise BI system.
What is the difference between analysis and a dashboard?
Analysis is the process of asking questions, cleaning data, finding patterns, and deciding what to do. A dashboard is one output of that process.
Can AI help with retail data analysis?
Yes. AI can help clean files, answer natural-language questions, create charts, highlight anomalies, generate forecasts, and summarize next steps.
Conclusion
Most retailers already have useful data. The harder part is turning it into action quickly enough to matter.
For many SMBs, the best starting point is a clear workflow, not a complex data project. Upload the files you already have, ask practical business questions, review the dashboard, and turn the findings into buying, pricing, promotion, or staffing decisions.
Turn your retail data into clearer decisions with hiData AI Sheets - schedule your demo today.