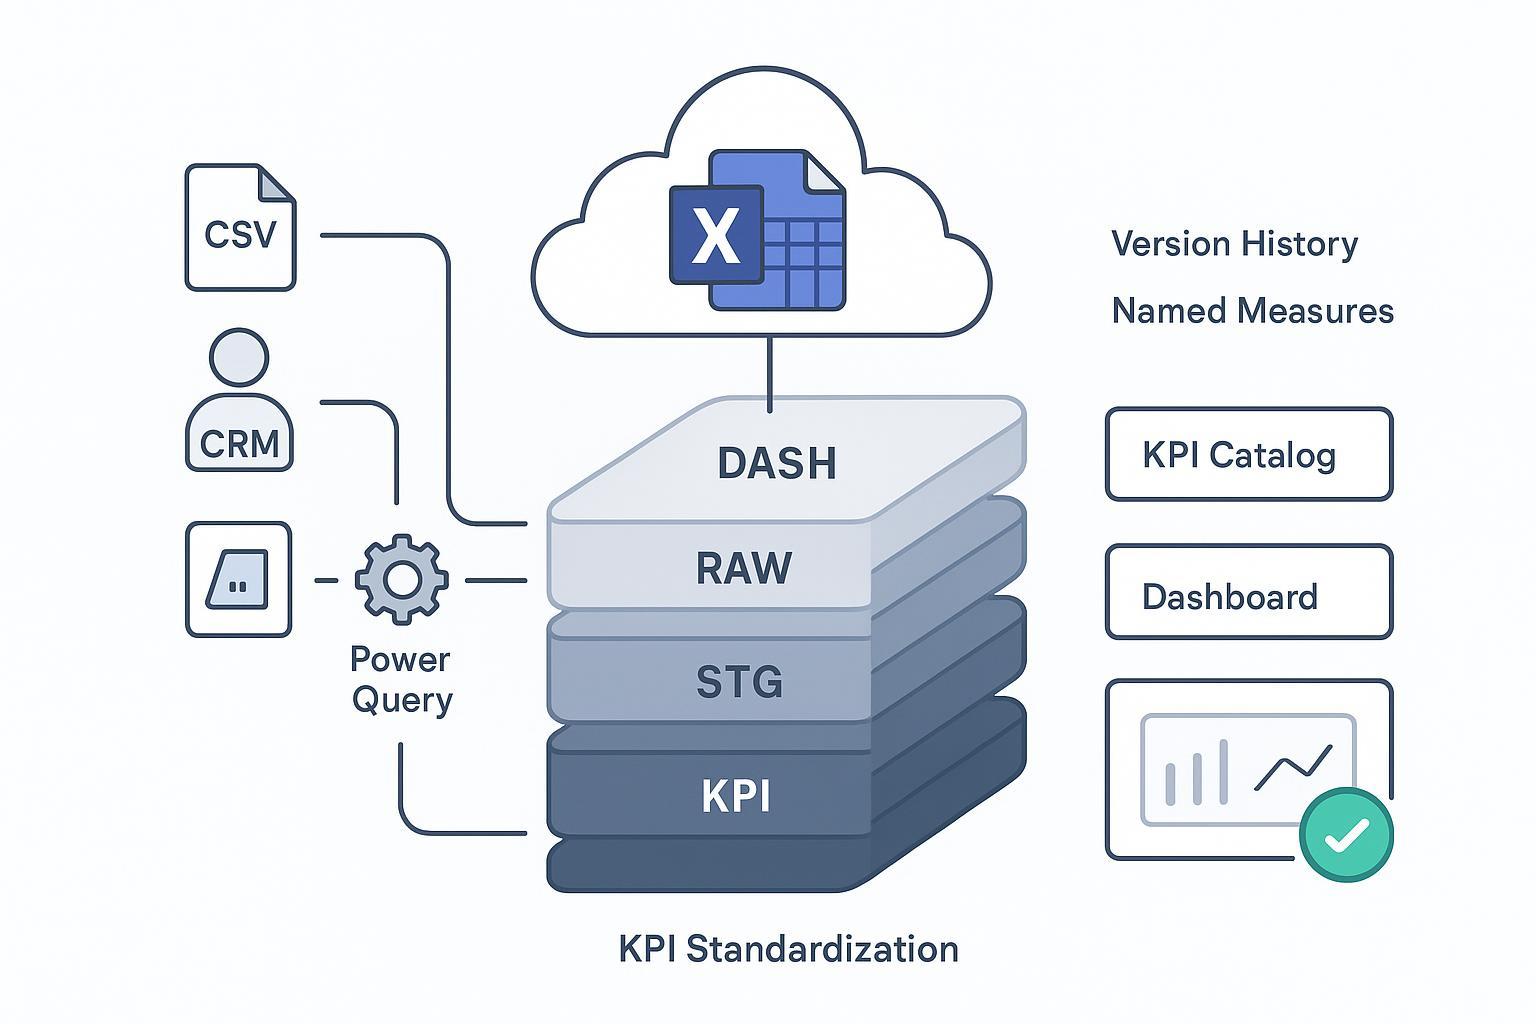
If three managers ask for “conversion rate” and you get three different numbers, you don’t have a data problem—you have a standardization problem. The fastest way to restore trust is to standardize Excel KPI formulas, publish one canonical workbook, and add a lightweight governance loop so definitions don’t drift with every new hire or campaign.
This guide gives you a practical blueprint to adapt: a template architecture, naming conventions, a validation toolkit, and a simple change-control process. Implementation time depends on the data and review requirements; the checks support consistency rather than guarantee error-free or investor-approved reporting.
Key Takeaways
Put one approved KPI workbook in a shared location with version history and a visible changelog; keep its outputs reconciled to the designated source records.
Use a layered template: Raw data, staged transforms with Power Query, a calculation layer with reusable measures, and a clean dashboard.
Create a KPI dictionary in an Index sheet that defines each metric, owner, calculation, source, and tolerance; enforce consistent names.
Add a Validation sheet with copy‑paste tests so you can catch nulls, date range issues, and reconciliation mismatches before publishing.
Train the team with a 60–90 minute workshop and a sample dataset; keep office hours for the first month to build habits.
Know when to keep it in Excel and when to graduate to Power BI as data size, relationships, and sharing needs grow.
Governance to Standardize Excel KPI Formulas
Start by deciding where the truth lives. Use a supported workbook in an approved OneDrive or SharePoint location with the relevant collaboration and versioning settings. Version history can help restore a prior file; it is not a complete cell-by-cell audit trail, so maintain change notes and review restored results. Microsoft explains how to restore prior versions in its guidance on how to restore a previous version of a file in OneDrive, which preserves history while making the restored file current (see Microsoft Support: Restore a previous version of a file). Read more in the official article: restore a previous version of a file stored in OneDrive.
Adopt a simple change‑control workflow so your KPI math doesn’t drift: Draft → Review → Tagged Release → Communicate → Rollback if needed using Version History. Keep notes in a Changelog sheet.
Define KPIs once and publish them. A KPI dictionary helps ensure the whole team uses the same definitions and tolerances. A practical field set: KPI Name, Business Purpose, Owner, Human‑readable Calculation, Exact Excel formula or measure, Data Source, Refresh Frequency, Tolerance or Thresholds, Data Quality Notes, Last Reviewed, and Changelog link. For context on how teams frame dashboards and governance fields, see the vendor overviews from Databox on what a KPI dashboard is and how teams organize metrics: KPI dashboard definition and examples from Databox.
Data privacy matters. Restrict access to sensitive KPI workbooks with appropriate permissions in your shared drive, and avoid embedding raw PII in shared templates. Keep customer‑level data in source systems and publish only the aggregates needed for the dashboard.
Template Design Patterns That Prevent Drift
Use a layered architecture so every change has a clear home and is easy to audit:
RAW layer: Drop unmodified exports here. No formulas, no edits. Treat it as read‑only.
STG layer: Use documented Power Query steps for repeatable cleaning and standardization where appropriate (types, trimming, mapping channels, normalizing dates). Power Query records transformation logic; preserve source versions and test refreshed results when files, schemas, or mappings change. Microsoft’s overview explains how queries capture and replay transformations: see the official introduction to Power Query in Excel.
KPI layer: Create reusable measures in the Data Model or named ranges that implement your approved KPI formulas.
DASH layer: Build the dashboard and any export views for PPT or PDF.
A layered template keeps calculations out of the presentation layer and confines cleaning to repeatable queries. When teammates ask, “Where does this number come from?”, you can trace it quickly.
Naming Conventions and Your KPI Catalog
Names are a cheap form of governance. Choose conventions that are short, readable, and consistent:
Files: company‑function_kpi‑standard_vYYYYMMDD.xlsx (for example, acme‑ops_kpi‑standard_v20260305.xlsx)
Tables: Domain_Object (Sales_Orders, Web_Sessions)
Columns: PascalCase or snake_case (OrderDate, NetRevenue)
Measures: MetricName or VerbNoun (TotalRevenue, ARPU)
Worksheets: RAW_, STG_, KPI_, DASH_, plus INDEX for your catalog
Lean on Excel’s structured references so formulas read like sentences instead of coordinates. Microsoft’s guide to using structured references with tables shows how expressions like =SUM(DeptSales[Sales Amount]) improve clarity and maintenance over A1 notation: using structured references with Excel tables.
Here’s a compact example of a catalog entry and its naming in practice:
KPI Name | Purpose | Measure or Formula | Source Table |
|---|---|---|---|
ConversionRate | Session purchase conversion; format the ratio as a percentage |
| Web_Sessions |
ARPU | Average revenue per user |
| Revenue records plus a defined active-user population |
ROAS | Return on ad spend |
| Ad_Performance |
For these examples, define the named totals as numeric values for the same reporting period and entity. SessionsWithPurchase counts sessions with at least one completed purchase; EligibleSessions counts the matching eligible sessions. ActiveUsers requires a defined user population, not an order count. RevenueFromAds requires an approved attribution window and policy, and AdSpend must cover the same scope. Recompute aggregate ratios from component totals, not an average of channel ratios. A zero or missing denominator is unresolved, not a measured 0% conversion rate or zero cost. Keep the INDEX sheet sortable and include owner, review date, and a link to the changelog row.
Testing and Validation You Can Trust
Make quality visible. Add a Validation sheet with a few pass/fail checks that surface problems before a stakeholder meeting. Excel’s built‑in Data Validation can enforce allowed values and numeric ranges and even circle invalid data for quick cleanup; Microsoft documents these options in its guide to data validation in Excel.
Adapt these examples to the actual data ranges before using them. In the first check, C2:C101 contains exactly 100 expected record values, with no header or unused rows. RevenueRange, ChannelRange, and DateRange are aligned, equally sized ranges; StartDate and EndDate are valid date-only cells, and Tolerance is a validated nonnegative amount in the reporting currency. The samples use English Excel names and comma separators. Evaluate the per-row date check against D2 in the source row (or a corresponding reference), then fill down. Use conditional formatting to make unresolved or failing checks visible.
// Blank rate among exactly 100 expected records; format as a percentage
=COUNTBLANK(C2:C101)/ROWS(C2:C101)

// Reconciliation check: validated numeric totals and nonnegative currency tolerance
=ABS(SourceTotal-DashboardTotal)<=Tolerance

// Row-level date-window check; includes all timestamps on EndDate
=AND(ISNUMBER(D2),D2>=StartDate,D2<EndDate+1)

// Paid revenue; ranges must have the same size and row alignment
=SUMIFS(RevenueRange,ChannelRange,"Paid",DateRange,">="&StartDate,DateRange,"<"&(EndDate+1))

// Last 7 daily observations within a separate 100-row daily metric series
// B2:B101 must be numeric, chronological, one row per consecutive calendar day
=IF(COUNT(B2:B101)<>ROWS(B2:B101),NA(),AVERAGE(INDEX(B2:B101,ROWS(B2:B101)-6):INDEX(B2:B101,ROWS(B2:B101))))
Trim or review whitespace before interpreting the blank rate; COUNTBLANK does not count a cell containing only spaces as blank, and cells containing errors require a separate check. The last formula averages the last seven records, so it represents seven days only after verifying consecutive daily dates, no duplicate dates, and one numeric value per day. Do not silently treat a missing day as zero. Change the bounded ranges when the actual record count changes. When cleaning data, use Power Query’s column profiling and types to catch issues early. You’ll see column quality bars and distributions that reveal nulls, outliers, or unexpected text in numeric fields during development—before anything reaches the dashboard.
Training and Onboarding That Scales
You don’t need a bootcamp—just a focused hour or two to build shared habits.
Workshop agenda for 60–90 minutes: Walk through the layered template. Import a small sample CSV into the RAW layer. Clean it in Power Query. Validate KPIs in the KPI layer with a PivotTable. Review Version History. Publish and share.
Office hours for the first four weeks: 30 minutes once a week to answer questions and review any formula or naming changes before they go live.
Etiquette: Announce tagged releases, avoid ad‑hoc edits in the DASH layer, and always propose changes via Draft → Review.
A short Quick Start on the INDEX sheet plus a tiny practice dataset goes a long way.
Tooling and Migration Triggers
Excel’s Data Model supports reusable measures and data that need not be loaded into a worksheet grid, but it still has memory, model, and file constraints. Evaluate the actual workload when considering centralized governance, security roles, and wider distribution. Microsoft’s migration guidance lays out how to evaluate volume, performance, and collaboration needs before moving models to Power BI; start with their overview of Power BI migration planning.
As a rule of thumb, stay in Excel if your data easily fits in the Data Model, you have a handful of fact tables, and the audience is small. Consider Power BI when you need shared semantic models, row‑level security, refresh automation, and easy access for non‑Excel users.
Common Pitfalls and Quick Fixes
Locale trouble: Mixed regional settings change decimal and date separators, breaking formulas. Document source locales, number/date parsing, and formula separators on the INDEX sheet; use explicit import locale settings where supported rather than assuming one workbook setting governs every machine.
Worksheet limits: Giant extracts push past row limits or slow saves. Where appropriate, load tables into the Data Model rather than the worksheet, or reduce/archive the source data. A .xlsb file may change size or loading behavior, but does not raise worksheet row limits or replace an archival policy; test the workbook and downstream compatibility.
Hidden logic in the dashboard: Hard‑coded cells and ad‑hoc formulas in visualization sheets cause drift. Keep calculations in the KPI layer and reference results in DASH only.
Practical Example: Standardize Revenue by Channel With hiData
Consider an illustrative weekly reporting process using shopping-cart, CRM, ad-platform, and user-activity exports. Files may label channels differently: “Paid Social,” “Social Paid,” or “FB Ads.” The goal is to apply an approved channel mapping and calculate defined ROAS and ARPU measures. This requires consistent attribution, ad spend, revenue, and an appropriate active-user population; channel labels alone cannot establish those measures.
Here’s a neutral, reproducible way to do it using your governed template and an assist from hiData:
In your template, keep the RAW layer for unmodified CSVs. In the STG layer, define the target Channel values you’ll accept in a small mapping table (e.g., Paid Search, Paid Social, Organic Search, Email, Direct, Referral, Other). That mapping belongs to governance: changes go through Draft → Review so historical comparisons remain valid.
If your team uses Power Query, trim text, set data types with an explicit locale, and join the approved mapping table on documented keys. For an AI-assisted review, upload approved Excel or CSV copies to hiData AI Sheets with the mapping file. Ask: “Standardize column labels, identify ambiguous dates, and apply only these approved exact channel mappings. Preserve original values and mark unmatched or ambiguous rows as Unmapped for review.” Do not classify every occurrence of “Meta” or “Instagram” as paid traffic: those labels can also describe organic activity. Inspect the transformed output and implement any recurring Power Query logic in your governed Excel process separately. This does not promise automatic STG-sheet writeback or an exported reusable transformation script.
Once standardized and reconciled, calculate KPIs in the governed KPI layer. ROAS is the defined attributed revenue divided by matching ad spend. ARPU uses a specified revenue measure and the corresponding active-user population. Compute each ratio from validated totals over the same reporting period, handle zero or missing denominators explicitly, and reference those approved results in the dashboard.
Validate before publishing. Check that transformed totals reconcile to the matching source totals using a documented tolerance and that every difference is explained. Require valid channels and dates for the intended scope; report missing and Unmapped values rather than dropping them. Verify date coverage and the ratio denominators, and keep review decisions with the release.
Publish the dashboard. Note the tagged release in the Changelog along with any mapping updates. If stakeholders raise questions, you can trace the lineage back to the mapping and STG transforms, then adjust through the governance flow rather than patching a formula in the dashboard.
This pattern makes standardization rules visible and helps reviewers trace a result back to the source, mapping, and calculation. AI Sheets supports review of uploaded files; the governed workbook and approval process remain your team’s responsibility. After reviewing the findings, AI Slides can help draft presentation content. This workflow does not imply a live data connection, scheduled execution, native Excel recalculation, or an automatic audit log.
Privacy note: Never paste customer‑level PII into shared demo workbooks. Keep sensitive data in source systems and apply least‑privilege access to the canonical workbook.
Next Steps
Start with one report: publish its approved definitions, add the INDEX and Validation sheets, test a small sample, and tag a reviewed release. Plan training and rollout time around the complexity of the data and controls.
Use the same representative files to compare your existing workflow with an AI-assisted preparation step, including review and correction time. Keep the version only if its outputs and controls meet the team’s requirements.