A supplier scorecard template gives procurement and operations teams a repeatable way to compare suppliers on delivery, quality, and price. This free Excel workbook includes line-level sample data, transparent formulas, editable weights, and a supplier summary. It is designed for a periodic review, not for approving a supplier or predicting a disruption.
Download the free supplier scorecard Excel template
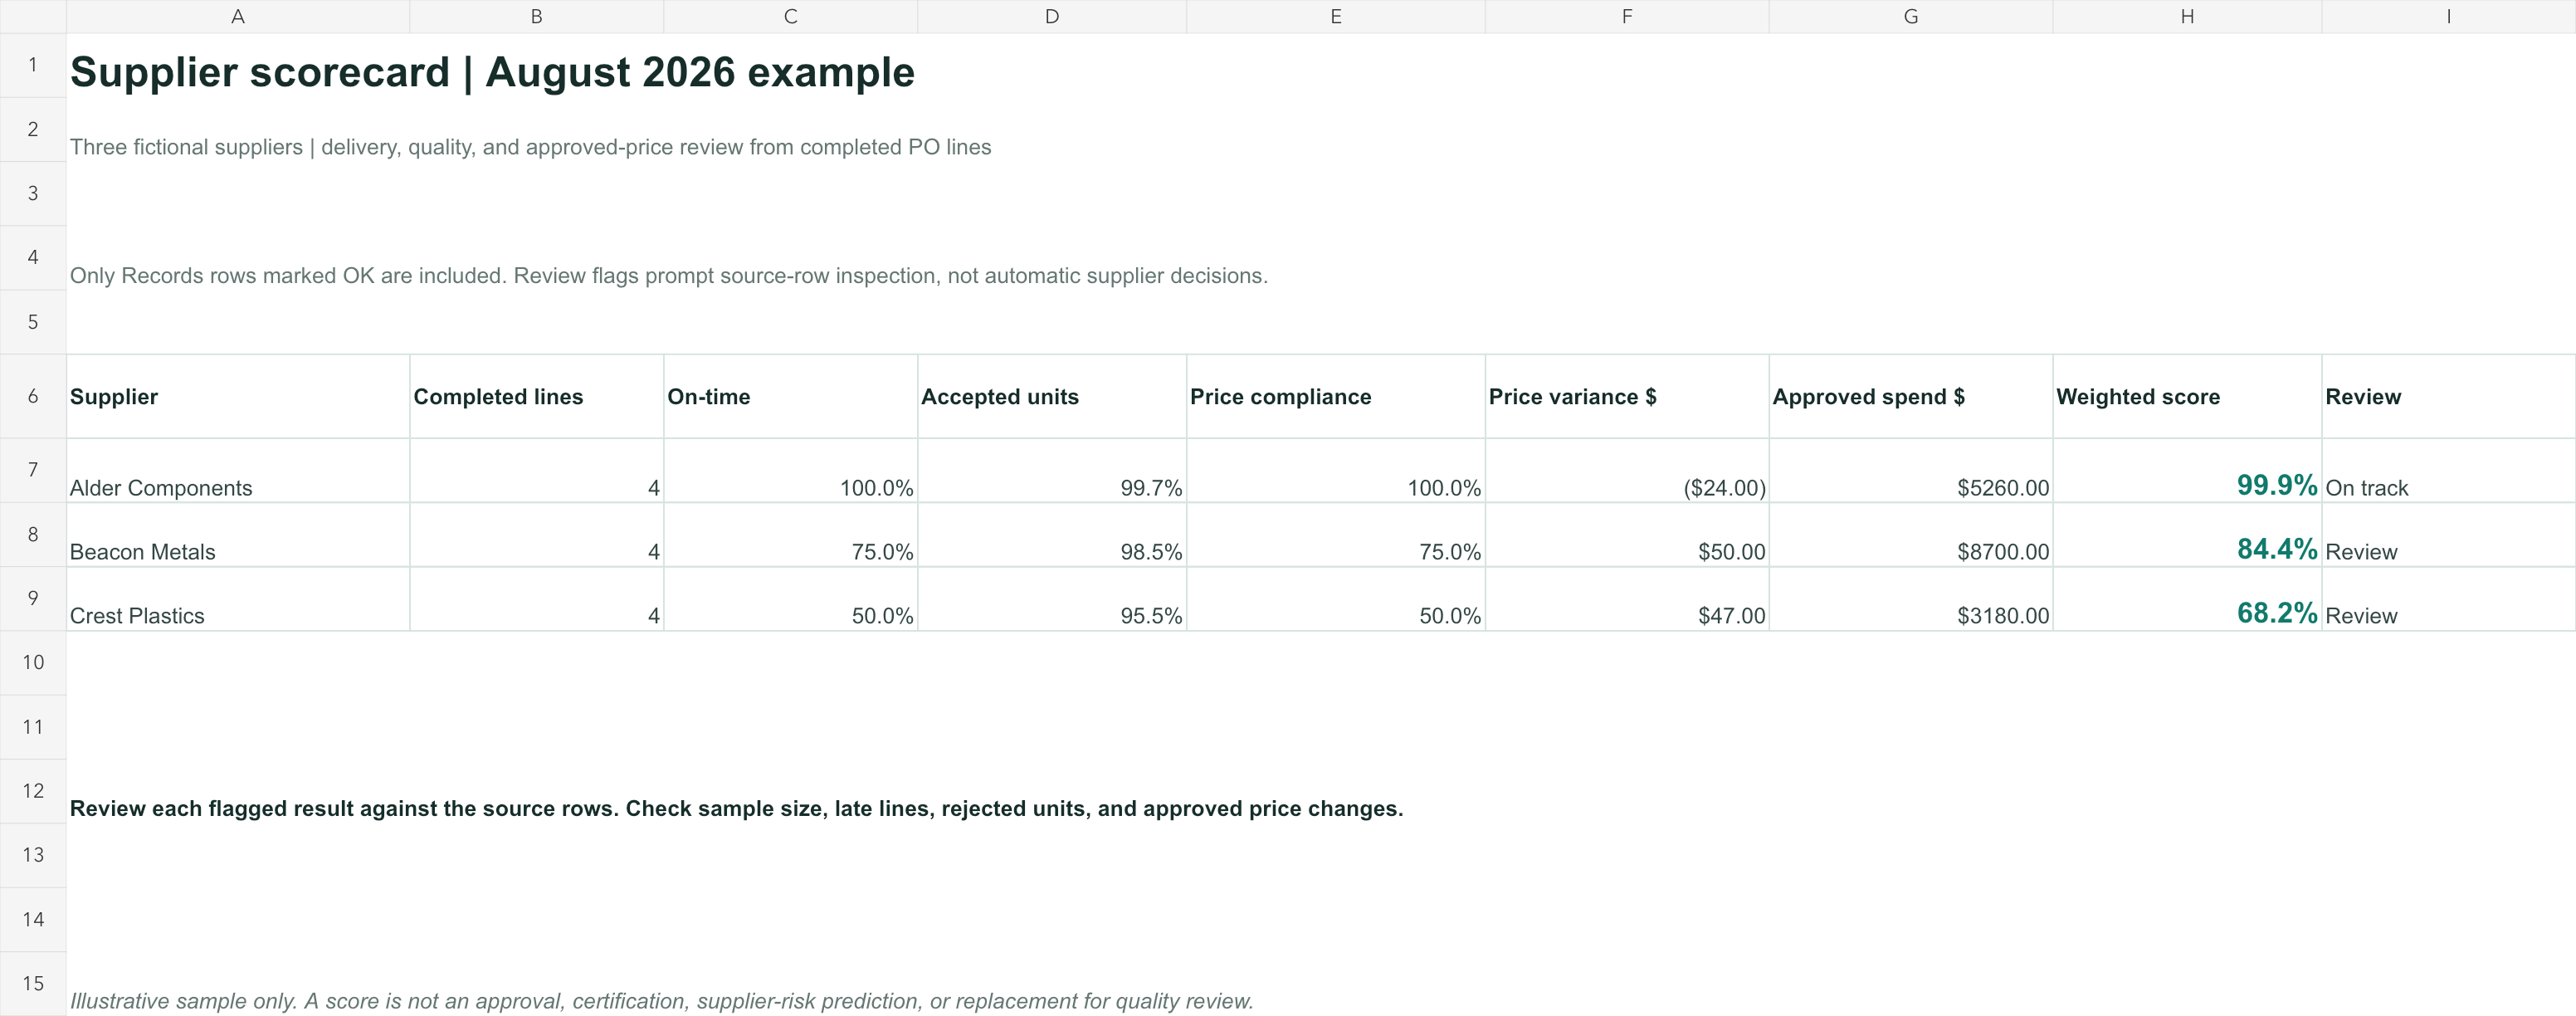
Illustrative manufacturing data. The image is rendered from the downloadable workbook; no customer or live hiData product data is shown.
What is a supplier scorecard?
A supplier scorecard is a structured record of how a supplier performed against agreed criteria during a defined period. Instead of relying on a general impression that a supplier is "reliable," a team can see which deliveries arrived on time, how much received material passed inspection, and whether invoiced prices matched the approved order.
The scorecard is a review aid, not a substitute for a contract, a quality audit, or a sourcing decision. SAP's supplier-performance guidance recommends consistent criteria, a small number of useful measures, and corrective actions based on the evaluation. The practical point is to define each measure before ranking suppliers. If one plant counts a shipment and another counts a PO line, their "on-time rate" is not comparable.
For a manufacturer, the most useful scorecard usually begins with purchase orders, receipts, incoming inspection, and approved prices. A service supplier may need different evidence, such as milestones, rework, and contract compliance. Keep the same decision logic, but do not force physical-goods metrics onto a service relationship.
What is in the free Excel template?
The workbook has three tabs. Scorecard is the review view, with supplier-level KPIs and a weighted score. Records holds one row per received PO line and calculates the on-time and price-compliance flags. Method explains the calculation rules and contains the editable weights and review thresholds. All names and amounts are fictional.
Start by replacing the yellow input cells on Records with your own exports. The sample has 12 received PO lines across three suppliers. The Scorecard supports the first 100 record rows; extend its formula ranges if your review contains more. The small sample uses standardized supplier names as its key. For production data, reconcile stable supplier IDs and PO-line IDs before populating the template, retain the original PO and receipt records, and review approved date or price changes before importing them.
The template uses a fixed example period rather than a live connection. Changing a source row recalculates the summary when opened in Excel. It does not pull data from an ERP, contact suppliers, approve invoices, or update purchase orders.
Which supplier KPIs should you calculate?
Begin with metrics that can be traced to source records. SAP's scorecard documentation treats quality, delivery, service, and compliance as possible indicators, with weights that reflect their importance. Our example uses three measures because they can be calculated from a common manufacturing export set. Add other measures only when the evidence and owner are clear.
| KPI | Calculation in this template | What to check before interpreting it |
|---|---|---|
| On-time delivery | Received PO lines on or before the approved due date / received PO lines | Use the same date basis; exclude open lines rather than silently calling them late. |
| Quality acceptance | Accepted units / received units | Confirm inspection coverage and whether rejected units were recorded consistently. |
| Price compliance | Received lines billed at or below approved unit price / received lines | Check currency, units, freight, taxes, and approved price changes. |
| Price variance | Sum of (billed unit price - approved unit price) x received quantity | Positive is above approved price; a negative value may reflect a discount, not necessarily a process improvement. |
On-time delivery needs a stable denominator
This workbook marks a received line on time when its receipt date is on or before the approved due date. It uses received lines as the denominator, so it is a retrospective delivery measure. Open or partially received lines need their own exception queue; they should not disappear from management review merely because this scorecard excludes them. Our purchase order management guide covers open commitments, status, receipt matching, and closure in more detail.
For split deliveries, choose a policy before calculating. You might score each receipt, each PO line only after it is fully received, or the share of ordered quantity delivered by the required date. These methods answer different questions. The downloadable template assumes one completed receipt per PO line and says so explicitly, rather than presenting a partial-delivery measure it cannot support.
Quality should reflect the inspection record
Quality acceptance divides accepted units by received units. This is easy to audit if the receiving team records both quantities, but it is not a universal defect rate. Units that were never inspected, later failed in production, or were returned by a customer may be outside the available dataset. If those events matter, add a separate quality measure with its own source and review period.
For a critical component, even a small rejected quantity may require investigation. The scorecard should trigger that conversation; a high overall score must not override an unresolved safety or specification issue. The example's thresholds are illustrative review rules, not industry standards or certification criteria.
Price variance needs the approved baseline
The approved PO unit price is the baseline in this template. A billed price above that baseline creates a positive variance, multiplied by received quantity to show the amount involved. The score also counts the percentage of lines billed at or below the approved price. These are related but different views: one measures dollars, the other counts compliant lines.
If a price change was formally approved, update the baseline from the approved change record before scoring. Do not quietly overwrite the original price in your source system. Mixing different currencies, units of measure, freight charges, or taxes can create a false variance. Resolve those differences before treating a number as a supplier issue.
How does the weighted score work?
The sample score uses 40% delivery, 40% quality, and 20% price compliance. In the workbook, each metric is a rate between zero and one, so the weighted score is:
Weighted score = 0.40 x on-time delivery rate
               + 0.40 x quality acceptance rate
               + 0.20 x price compliance rate
The weights are editable on the Method tab, and a visible check confirms that they total 100%. They are a teaching example, not a recommended universal policy. If a rejected part can stop a production line, quality may deserve more weight. If the category is a commodity with reliable alternates, price may matter more. Set weights with procurement, quality, and operations before looking at the supplier rankings; changing them afterward to favor a preferred vendor defeats the purpose.
There is no single supplier-risk prediction hidden inside the score. A Review flag appears if an illustrative threshold is missed: on-time delivery below 90%, quality acceptance below 98%, or positive price variance above 2%. That flag means someone should inspect the underlying rows. It does not state that the supplier is financially distressed, non-compliant, or likely to fail.
A worked supplier scorecard example
Suppose Beacon Metals has four completed PO lines in the review period. Three arrived by the approved due date, so its on-time rate is 75%. It delivered 400 units, of which 394 were accepted, giving 98.5% quality acceptance. Three of its four billed unit prices were at or below the approved price, so price compliance is 75%.
Its weighted score is 0.40 x 75% + 0.40 x 98.5% + 0.20 x 75% = 84.4%. The workbook also shows a positive price variance of $50 on the one above-price line. The score is not the decision by itself. A buyer should identify the late line, confirm the approved date and price, ask quality whether the six rejected units share a root cause, and record an owner and follow-up date.
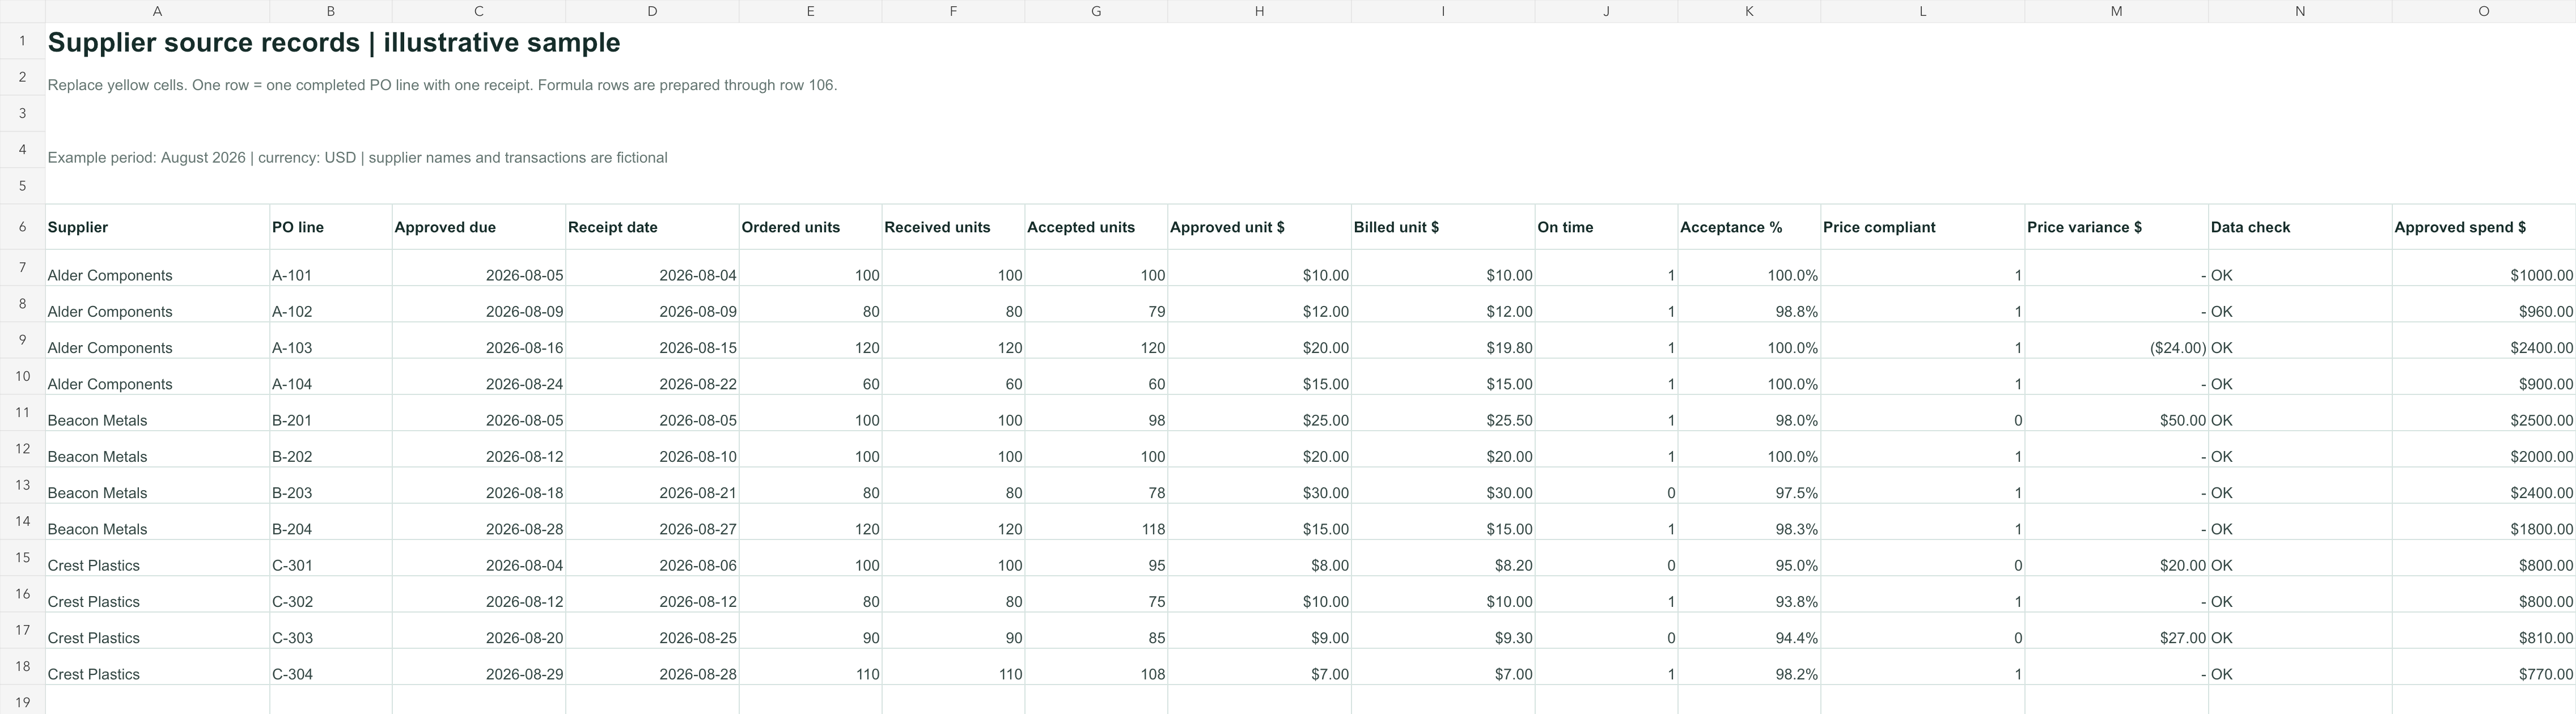
The line-level view makes the summary traceable. Yellow cells are sample inputs; calculated columns are not intended for manual entry.
The other two fictional suppliers give the reviewer context: one performs consistently and one misses several delivery, quality, and price checks. Comparing the rows is more useful than declaring a supplier "good" or "bad" from one composite number. A low score could reflect a one-off disruption, a data error, a small sample, or a persistent issue. The evidence determines the next action.
How to use the template in a monthly review
First, agree on the review period, the approved due-date rule, and the unit of analysis. In this workbook, the unit is a completed PO line with one receipt. Filter your exports to the same period before replacing the sample data. Keep a copy of each original export so reviewers can trace the scorecard back to its source.
Next, reconcile supplier IDs and PO-line IDs before transferring data into the workbook. A supplier may appear under several names; a PO can also have several lines or receipts. Do not join source files on a display name alone. Normalize names for the template's supplier column after resolving IDs, and keep that mapping with your review. If your data contains partial receipts, consolidate them under a documented rule before using this template, or adapt the workbook to score receipt events explicitly.
Then check dates, quantities, and prices. Accepted quantity cannot exceed received quantity. Received quantity should not exceed ordered quantity without an approved over-delivery rule. Price comparisons need the same currency and unit of measure. Microsoft's SUMIFS guidance explains the conditional aggregation pattern used to build supplier summaries from line-level records.
After refreshing the inputs, read the Scorecard from left to right: sample size, delivery, quality, price, and weighted result. Open the underlying Records tab for every unusual score. A supplier with one completed line should not be compared casually with one that handled hundreds. Document the action, owner, and next review date outside the score; the template is a measurement aid, not a supplier-management system.
From Excel exports to a reviewable dashboard with hiData
When PO, receipt, inspection, and price data live in separate files, preparing a consistent dataset can take longer than making the chart. With hiData AI Sheets, a team can upload supported files and ask for a supplier-by-supplier summary, a view of late receipts, or a chart of quality acceptance and price variance from the data provided. The user should verify joins, definitions, and exceptions before acting on the output.
A practical prompt is: "Using these uploaded PO, receipt, and inspection exports, match supplier IDs and PO-line IDs. Show which lines have missing dates or inconsistent quantities. Then summarize on-time receipt rate and accepted-unit rate by supplier. List every source row behind a flagged result." Another prompt can compare approved and billed unit prices after the team has confirmed currency and units.
This is analysis of uploaded data, not a claim of direct ERP synchronization, automated supplier communication, contract enforcement, or official supplier-risk certification. Keep the Excel scorecard available as an auditable reference and use the dashboard to make patterns and exceptions easier to review.
Mistakes that make supplier scores misleading
Changing the denominator between periods. If last month used shipments and this month uses PO lines, a trend can move even when supplier behavior did not. Label the counting unit and keep it stable.
Scoring partial receipts as complete. A first shipment may arrive on time while the balance is weeks late. Decide whether you are measuring first receipt, final receipt, or quantity delivered by the due date. This template is for completed, single-receipt lines.
Blending unverified source records. Supplier aliases, duplicate PO-line IDs, missing receipt dates, or mixed currencies can distort every downstream metric. Resolve these before publishing a ranking.
Treating the composite score as an approval. Weighted averages can hide a serious quality event. Review the underlying quality and delivery exceptions and follow the organization's approval and escalation rules.
Frequently asked questions
What is a supplier scorecard template?
It is a reusable worksheet for recording supplier KPIs, calculation rules, review periods, and an overall assessment. A useful template shows the underlying records, not just the final rating.
Is this template suitable for Excel?
Yes. The download is a real .xlsx workbook with editable sample inputs and formulas. It covers 100 record rows by default; extend the ranges for a larger dataset.
How do you calculate on-time delivery?
In this example, count completed PO lines received on or before their approved due date and divide by all completed PO lines in the review period. Other counting units are possible, but they must be stated.
How do you score supplier quality?
This template divides accepted units by received units. It does not include later field failures or uninspected material, so review the inspection policy before treating it as a complete quality measure.
What is a good supplier score?
There is no universal cutoff. Agree on weights and thresholds for the category before reviewing results. A serious safety or compliance issue may require escalation regardless of the composite score.
Can hiData manage suppliers automatically?
No. hiData AI Sheets can help analyze uploaded supplier-related files and present summaries or visualizations. Supplier approval, communication, contract management, and corrective actions remain with the responsible team and systems.
Review your supplier data with hiData AI Sheets
Upload your PO, receipt, inspection, and price exports to explore supplier performance and prepare a reviewable summary. Confirm source records and metric rules before taking action.