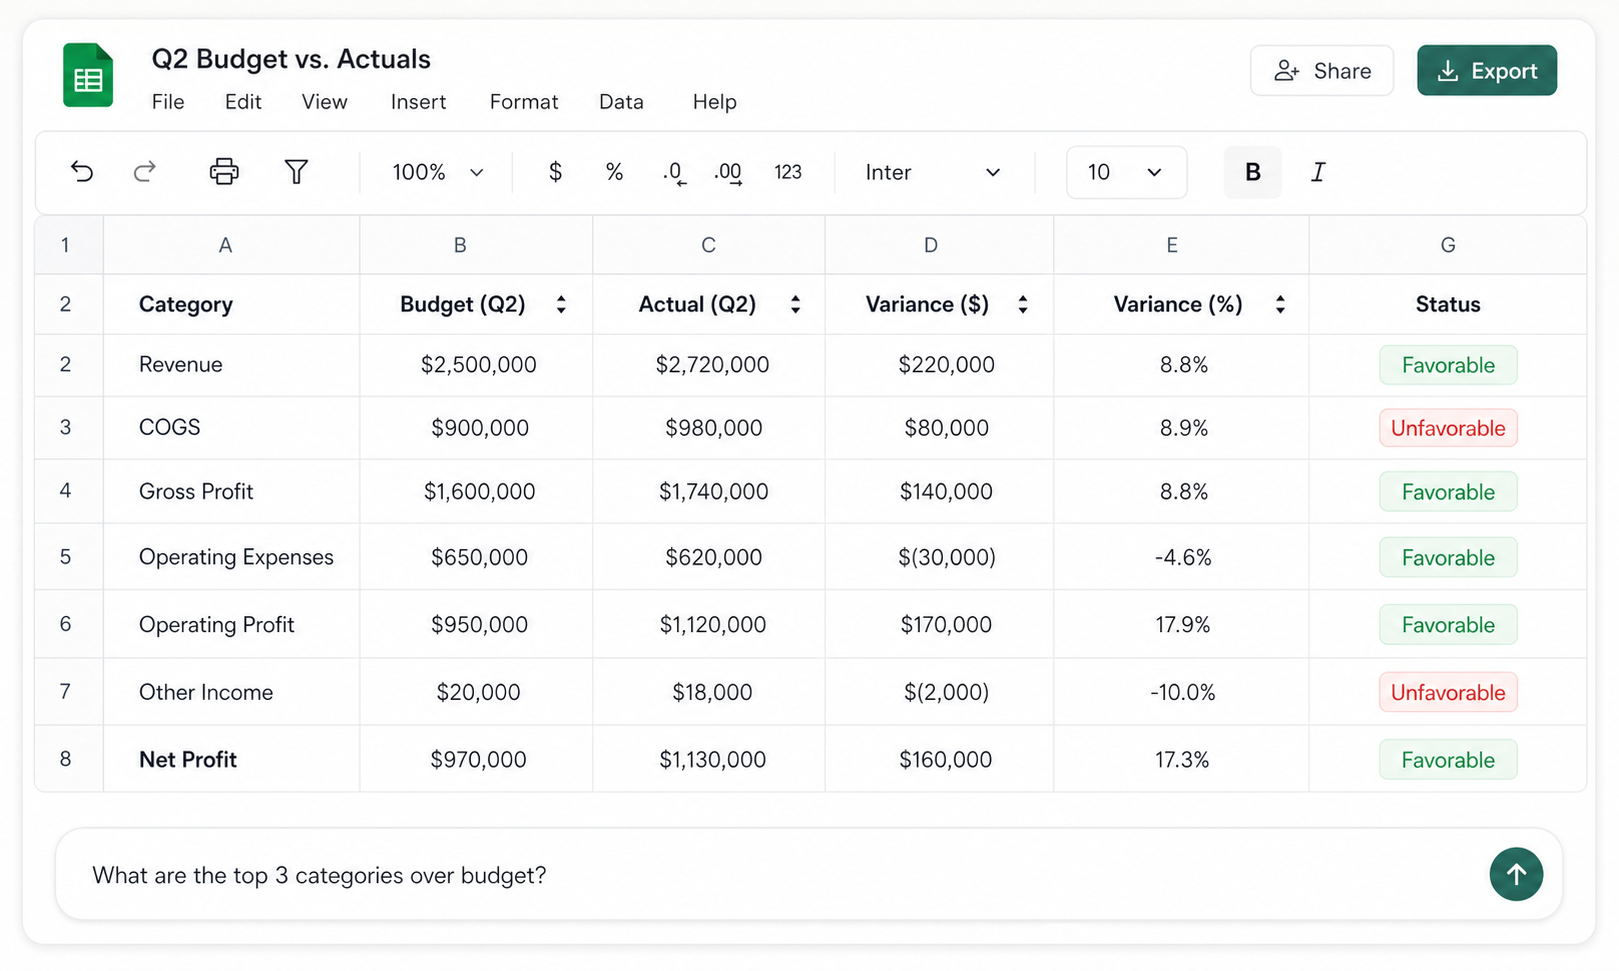
Budget variance analysis compares actual results with an approved budget, identifies which differences are favorable or adverse, and explains what caused the important gaps. In Excel, the core calculation is simple. The useful work begins after the subtraction: applying the right direction to revenue and expenses, setting materiality thresholds, tracing the variance to operational drivers, and documenting an action.
This guide uses one consistent sign convention: variance equals actual minus budget. A positive revenue or profit variance is favorable. A positive expense variance is adverse. Keeping the mathematical sign separate from the business interpretation prevents the common mistake of calling every positive number favorable.
Download the budget variance analysis Excel template
Illustrative product scenario. AI Sheets analyzes files that a user uploads; this workflow does not claim a direct accounting-system connection or real-time database sync.
What is budget variance analysis?
Budget variance analysis is the process of comparing actual financial results with the amounts approved in a budget for the same period and reporting basis. This matches IBM's description of variance analysis as a comparison between actual and planned performance. A useful report usually shows the variance amount, variance percentage, favorable or adverse direction, explanation, owner, and next action.
A variance is not automatically a problem. Revenue can exceed budget because demand or pricing improved. Spending can come in below budget because a team negotiated better rates, but it can also be low because a planned hire or campaign was delayed. The number tells you where the plan and reality differ. The explanation tells you whether that difference is good, temporary, recurring, or caused by an error.
The analysis belongs inside the monthly management-reporting cycle. Teams often use it after the close, once actuals have been reconciled, and before updating the forecast. If the gap is likely to continue, the variance should inform the next budget forecast rather than remain a comment about the past.
Budget variance formulas in Excel
Use the same mathematical formula for every line, then apply a separate rule for business direction. This keeps totals easy to reconcile and avoids changing signs between revenue and expense rows.
| Measure | Excel formula | Interpretation |
|---|---|---|
| Variance amount | =Actual-Budget |
Positive means actual is higher than budget; negative means actual is lower. |
| Variance percentage | =IF(Budget=0,"n.a.",Variance/ABS(Budget)) |
Measures the gap relative to budget. A zero budget has no meaningful percentage. |
| Revenue or profit status | Positive = Favorable; negative = Adverse | Higher revenue or profit usually improves the result. |
| Expense status | Negative = Favorable; positive = Adverse | Lower expense usually improves the result. |
Suppose column B contains the line type, column C contains budget, column D contains actual, and column E contains the variance. The formulas can be written as:
E2 = D2-C2
F2 = IF(C2=0,"n.a.",E2/ABS(C2))
G2 = IF(E2=0,"On budget",
     IF(OR(B2="Revenue",B2="Profit"),
        IF(E2>0,"Favorable","Adverse"),
        IF(E2<0,"Favorable","Adverse")))
Some companies present expense savings as a positive variance by reversing the cost formula. That convention is valid when it is applied consistently, but it makes reconciliation harder when revenue and expense rows use different arithmetic. Whichever convention you choose, state it above the report and never rely on color alone to communicate direction.
Favorable and adverse variances are not the same as positive and negative
For revenue, actual results above budget normally create a favorable variance. If budgeted revenue was $500,000 and actual revenue was $530,000, the variance is positive $30,000 and favorable. If actual revenue was $470,000, the variance is negative $30,000 and adverse.
Expenses work in the opposite business direction. If software expense was budgeted at $20,000 and actual expense was $26,000, the mathematical variance is positive $6,000, but the result is adverse because the company spent more. If actual expense was $18,000, the negative $2,000 variance is favorable.
Context still matters. An adverse marketing variance may be reasonable if it funded incremental revenue with an acceptable return. A favorable payroll variance may reflect vacancies that slowed delivery. The status is a first classification, not the final conclusion.
How to perform budget variance analysis in Excel
1. Lock the comparison basis
Start with the approved budget version and actuals for exactly the same period. Confirm the currency, legal entities, departments, account mapping, accrual basis, and treatment of eliminations. A perfectly calculated variance is still wrong if the budget covers a calendar month and the actuals cover a fiscal period, or if one side includes an entity that the other side excludes.
Keep the original exports unchanged. Work from copies and record the budget version, reporting date, and source files used. If the budget has been revised, label the comparison clearly as original budget, revised budget, or latest forecast. Do not quietly replace the approved baseline.
2. Align budget and actual line items
Map both files to the same chart-of-accounts or management-reporting categories. Watch for renamed accounts, new departments, reclassifications, and duplicate rows. If one budget line maps to several actual accounts, document the mapping rather than manually typing a combined number into the report.
Reconcile the aligned actual total to the relevant profit and loss statement. Then reconcile the budget total to the approved budget file. These two controls should pass before anyone investigates individual variances.
3. Calculate amount and percentage variance
Calculate Actual - Budget for each comparable line. The amount shows the financial impact. The percentage shows scale relative to the plan. You need both because a $10,000 gap can be immaterial on a $5 million line and critical on a $20,000 line.
Do not divide by zero or replace an unavailable percentage with 0%. When the budget is zero, show n.a. and review the amount separately. A new unbudgeted cost of $25,000 is not a 0% variance. It is a $25,000 adverse variance without a meaningful percentage denominator.
4. Assign favorable or adverse direction
Classify each row by economic meaning. Revenue and profit normally improve when actual is higher. Expenses normally improve when actual is lower. For taxes, gains, losses, contra-revenue, recoveries, or other sign-sensitive accounts, define the rule explicitly rather than forcing them into a generic revenue-or-expense label.
Use text labels as well as color. Green and red can help scanning, but the words Favorable, Adverse, and On budget make the report understandable when printed, exported, or read by someone with color-vision differences.
5. Apply materiality thresholds
Not every difference needs commentary. A practical rule combines an absolute threshold and a percentage threshold. For example, investigate a line when the absolute variance is at least $5,000 or the absolute percentage is at least 5%.
The thresholds should reflect the scale and purpose of the report. A board report may focus on larger consolidated gaps. A department review may use smaller thresholds. Some lines, such as revenue, payroll, cash, or regulatory costs, may require review regardless of size. Keep thresholds visible and editable instead of burying them inside formulas. The Association for Financial Professionals similarly treats investigation and explanation as part of the review, not merely the calculation.
6. Trace the variance to a driver
Move from account totals to the operational causes behind them. Revenue commonly changes because of price, volume, mix, discounts, churn, timing, or foreign exchange. Payroll changes because of headcount, start dates, overtime, bonuses, vacancies, or rate changes. Software changes because of seats, usage, renewals, plan upgrades, and foreign currency.
Separate a real operating driver from an accounting timing difference or data problem. An invoice posted one month late, an accrual reversal, a miscoded department, and a recurring supplier price increase require different actions even if they create the same variance amount.
7. Write the explanation and action
A useful variance comment contains four parts: what changed, why it changed, whether it is timing or recurring, and what happens next. Avoid comments such as “over budget due to higher costs.” They repeat the result without explaining it.
A stronger comment is: “Software expense was $8,500 adverse because the annual analytics renewal posted in August and 18 seats were added earlier than planned. The renewal is a timing difference; the additional seats increase the monthly run rate by about $1,200. Finance will update the remaining forecast after the department confirms active users.”
8. Reconcile the bridge and update the forecast
The driver explanations should add back to the reported variance. If gross profit was $14,000 below budget and operating expenses were $24,700 above budget, operating income should be $38,700 below budget. An unexplained remainder means the analysis is incomplete or the categories do not reconcile.
Once a recurring driver is confirmed, update the forecast assumptions. Keep the original budget unchanged so management can still see performance against the approved plan. The forecast is the current expectation; the budget remains the baseline.
Worked budget vs actual example
The downloadable workbook uses illustrative monthly data. Revenue was $18,000 below budget. COGS was $4,000 below budget, which was favorable as an expense but not enough to offset the revenue shortfall. Gross profit therefore finished $14,000 below plan. Operating expenses were $24,700 above budget, leaving operating income $38,700 below budget.
| Line item | Budget | Actual | Variance | Status | Driver to verify |
|---|---|---|---|---|---|
| Revenue | $500,000 | $482,000 | ($18,000) | Adverse | Lower unit volume partly offset by higher average price |
| COGS | $225,000 | $221,000 | ($4,000) | Favorable | Lower spend follows lower volume; check unit cost |
| Gross profit | $275,000 | $261,000 | ($14,000) | Adverse | Revenue shortfall exceeds the COGS saving |
| Sales and marketing | $70,000 | $78,000 | $8,000 | Adverse | Campaign timing and contractor costs |
| Software | $21,000 | $29,500 | $8,500 | Adverse | Annual renewal and added seats |
| Operating expenses | $229,000 | $253,700 | $24,700 | Adverse | Software and marketing explain most of the overspend |
| Operating income | $46,000 | $7,300 | ($38,700) | Adverse | Gross-profit miss plus operating-expense overspend |
The percentage view changes the priority. The $18,000 revenue miss is 3.6% of budget, while the $8,500 software overspend is 40.5%. Reviewing both amount and percentage prevents a large account from hiding a meaningful rate change in a smaller one.
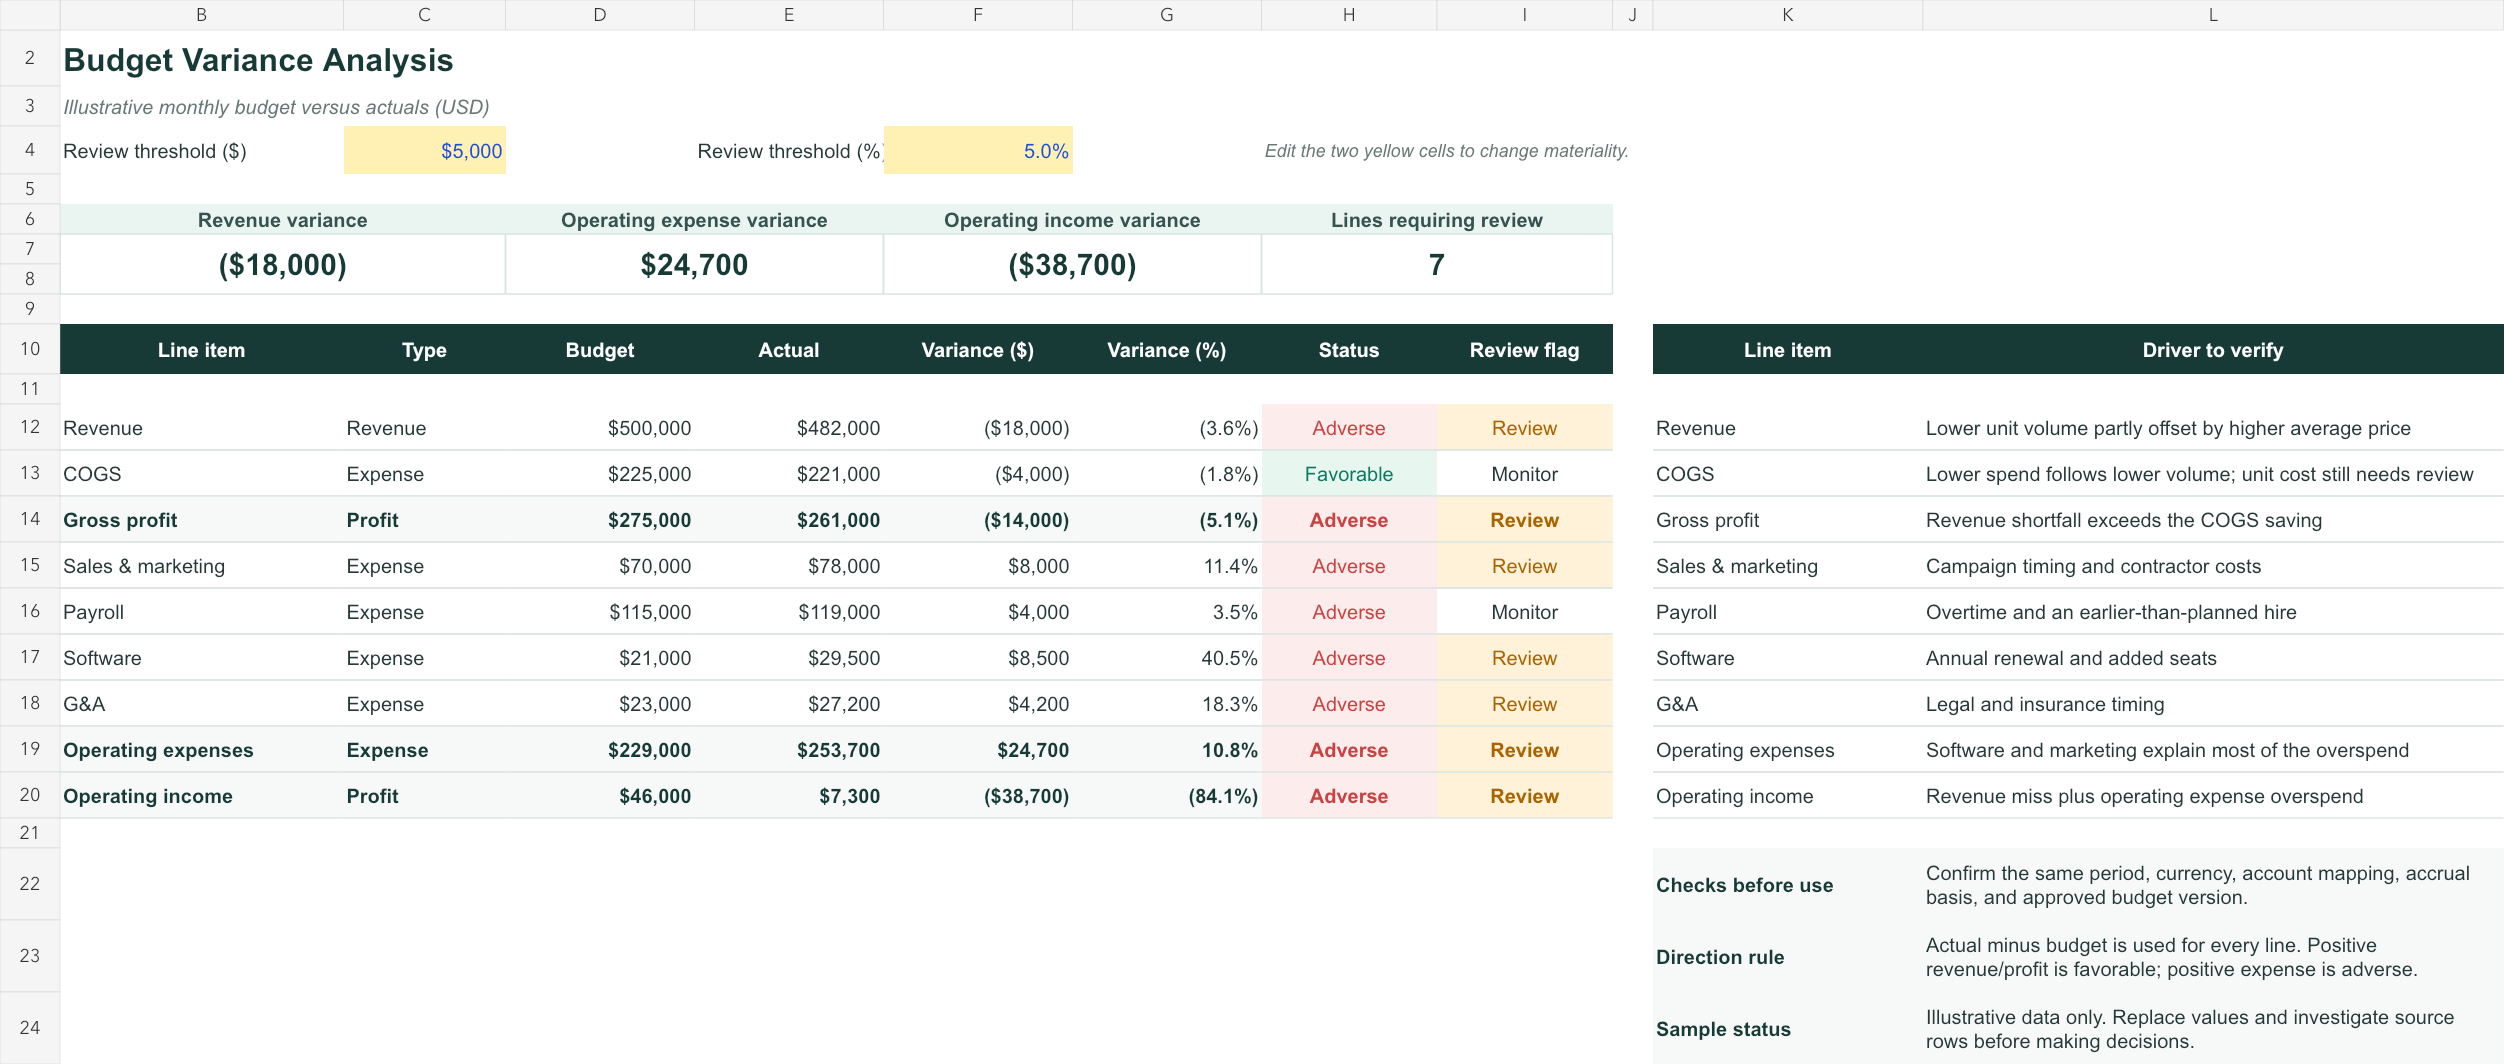
Illustrative sample data. The workbook contains formulas and editable thresholds; replace the sample values and verify the source data before using the output.
How to explain the drivers behind a variance
The account name rarely provides a complete explanation. Use the most relevant driver model for the line being reviewed.
For revenue, start with price and volume. Compare actual units with budgeted units, then compare actual average price with budgeted price. If the company sells several products, add mix because a shift toward lower-margin products can reduce profit even when total units rise. Timing also matters when contracts, shipments, or invoices move between periods.
For variable costs, compare the quantity consumed and the rate paid. Lower COGS may be favorable, or it may simply follow lower sales. A flexible budget can separate the cost effect of lower activity from purchasing or efficiency performance. Static-budget comparisons remain useful, but they should not label every volume-related cost change as operational efficiency.
For payroll, use headcount, paid FTE, start dates, base pay, overtime, commissions, bonuses, and employer costs. For software, use contracts, seats, usage, price increases, renewals, and foreign exchange. For professional services, identify project scope, rate, hours, and timing.
Finally, classify the cause as timing, one-time, or recurring. Timing differences may reverse next month. One-time items affect the current result but not the future run rate. Recurring changes belong in the forecast.
Using AI Sheets for budget variance analysis
AI is most helpful after the reporting basis is defined. It can reduce manual spreadsheet work, flag material gaps, group related drivers, and draft a first management summary. It should not choose the approved budget version or decide that a variance is acceptable without finance review.
With hiData AI Sheets, upload the budget, actuals, account mapping, and any department or transaction exports needed for the analysis. Ask it to standardize account names, align comparable periods, calculate amount and percentage variances, apply your favorable/adverse rules, flag material rows, and preserve the source records behind each result.
Useful prompts include:
- “Compare actuals with the approved budget using actual minus budget. Treat positive revenue and profit variances as favorable and positive expense variances as adverse.”
- “Flag any line where the absolute variance is at least $5,000 or the absolute variance percentage is at least 5%. Show
n.a.when budget is zero.” - “For every flagged line, identify the departments, vendors, products, or transactions that explain most of the difference. Do not invent a cause when the uploaded files do not contain enough evidence.”
- “Draft a management summary that separates timing differences, one-time items, recurring changes, data corrections, and actions. Cite the source rows used for each explanation.”
Review the output against the approved budget and reconciled actuals. Confirm mappings, signs, percentages, thresholds, and driver totals. AI can organize the evidence and draft commentary, but the finance team remains responsible for the accounting basis, conclusion, and action.
Common budget variance analysis mistakes
The first mistake is using inconsistent signs. A positive number does not always mean favorable. Keep one arithmetic convention and a separate status rule.
The second is comparing mismatched periods or budget versions. A monthly actual cannot be compared with a quarterly budget without a valid allocation, and a revised forecast should not silently replace the approved budget.
The third is relying only on percentage variance. Small or zero budgets create extreme or unavailable percentages. Use both amount and percentage thresholds.
The fourth is explaining totals without tracing source rows. A comment should be supported by transactions, departments, products, headcount, or another observable driver. If the available files do not contain the cause, label it for follow-up instead of guessing.
The fifth is treating every underspend as good news. Delayed hiring, postponed maintenance, missing accruals, or unrecorded invoices can create a favorable-looking result that does not improve the underlying business.
The sixth is updating the forecast without preserving the original budget. Keep the budget as the approved baseline and use the forecast to record the latest expectation.
Budget variance review checklist
Before sharing the report, confirm that budget and actuals cover the same period, entities, currency, and accounting basis. Reconcile totals to their source files. Verify that formulas use the documented sign convention, budget-zero percentages are unavailable, and favorable/adverse labels follow the economic meaning of each line.
Check that materiality rules are visible, driver explanations reconcile to the headline variance, and every major comment distinguishes timing from recurring effects. Assign an owner and next action. Update the forecast only after the driver is supported by evidence.
Frequently asked questions
What is the formula for budget variance?
A consistent formula is Actual - Budget. Use a separate rule to interpret the sign: positive is normally favorable for revenue and profit, while positive is normally adverse for expenses.
How do you calculate budget variance percentage?
Divide the variance amount by the absolute budget: (Actual - Budget) / ABS(Budget). If budget is zero, the percentage is not meaningful; show n.a. and review the amount.
What is a favorable budget variance?
A favorable variance improves the financial result compared with budget. It usually means revenue or profit is higher than budget, or an expense is lower than budget. The operational context still needs review.
What is an adverse budget variance?
An adverse variance reduces the financial result compared with budget. It usually means revenue or profit is below budget, or an expense is above budget.
What materiality threshold should be used?
There is no universal threshold. Many teams combine an absolute amount and a percentage, then add mandatory review rules for important accounts. The threshold should match the company's scale, reporting audience, and risk.
Can AI perform budget variance analysis from Excel files?
AI Sheets can analyze uploaded Excel or CSV files, align fields, calculate variances, flag material rows, and draft explanations from the available evidence. Finance users should still verify the source data, accounting treatment, mapping, and conclusions.
What is the difference between a budget and a forecast variance?
Budget variance compares actuals with the approved plan. Forecast variance compares actuals or a newer forecast with the latest expected result. Keep the labels separate because the baselines answer different management questions.
Analyze budget vs actuals with hiData
Upload your budget, actuals, account mapping, and supporting Excel or CSV exports to AI Sheets. Calculate variances, apply review thresholds, trace important differences to the available source rows, and prepare a management summary for finance review.