Discounted cash flow analysis estimates what a business, project, or investment is worth today by forecasting future cash flows and discounting them for time and risk. In Excel, the model typically combines forecast free cash flow, a matching discount rate, terminal value, and sensitivity analysis.
This guide walks through the complete calculation using an illustrative company example. It also explains how hiData AI Sheets can help organize and review data from uploaded spreadsheets, while leaving assumptions and final valuation decisions with the finance team.
The figures in this article were created for demonstration. They are not customer data, market benchmarks, an investment recommendation, or a representation of any company's financial results.
Download the discounted cash flow analysis Excel template
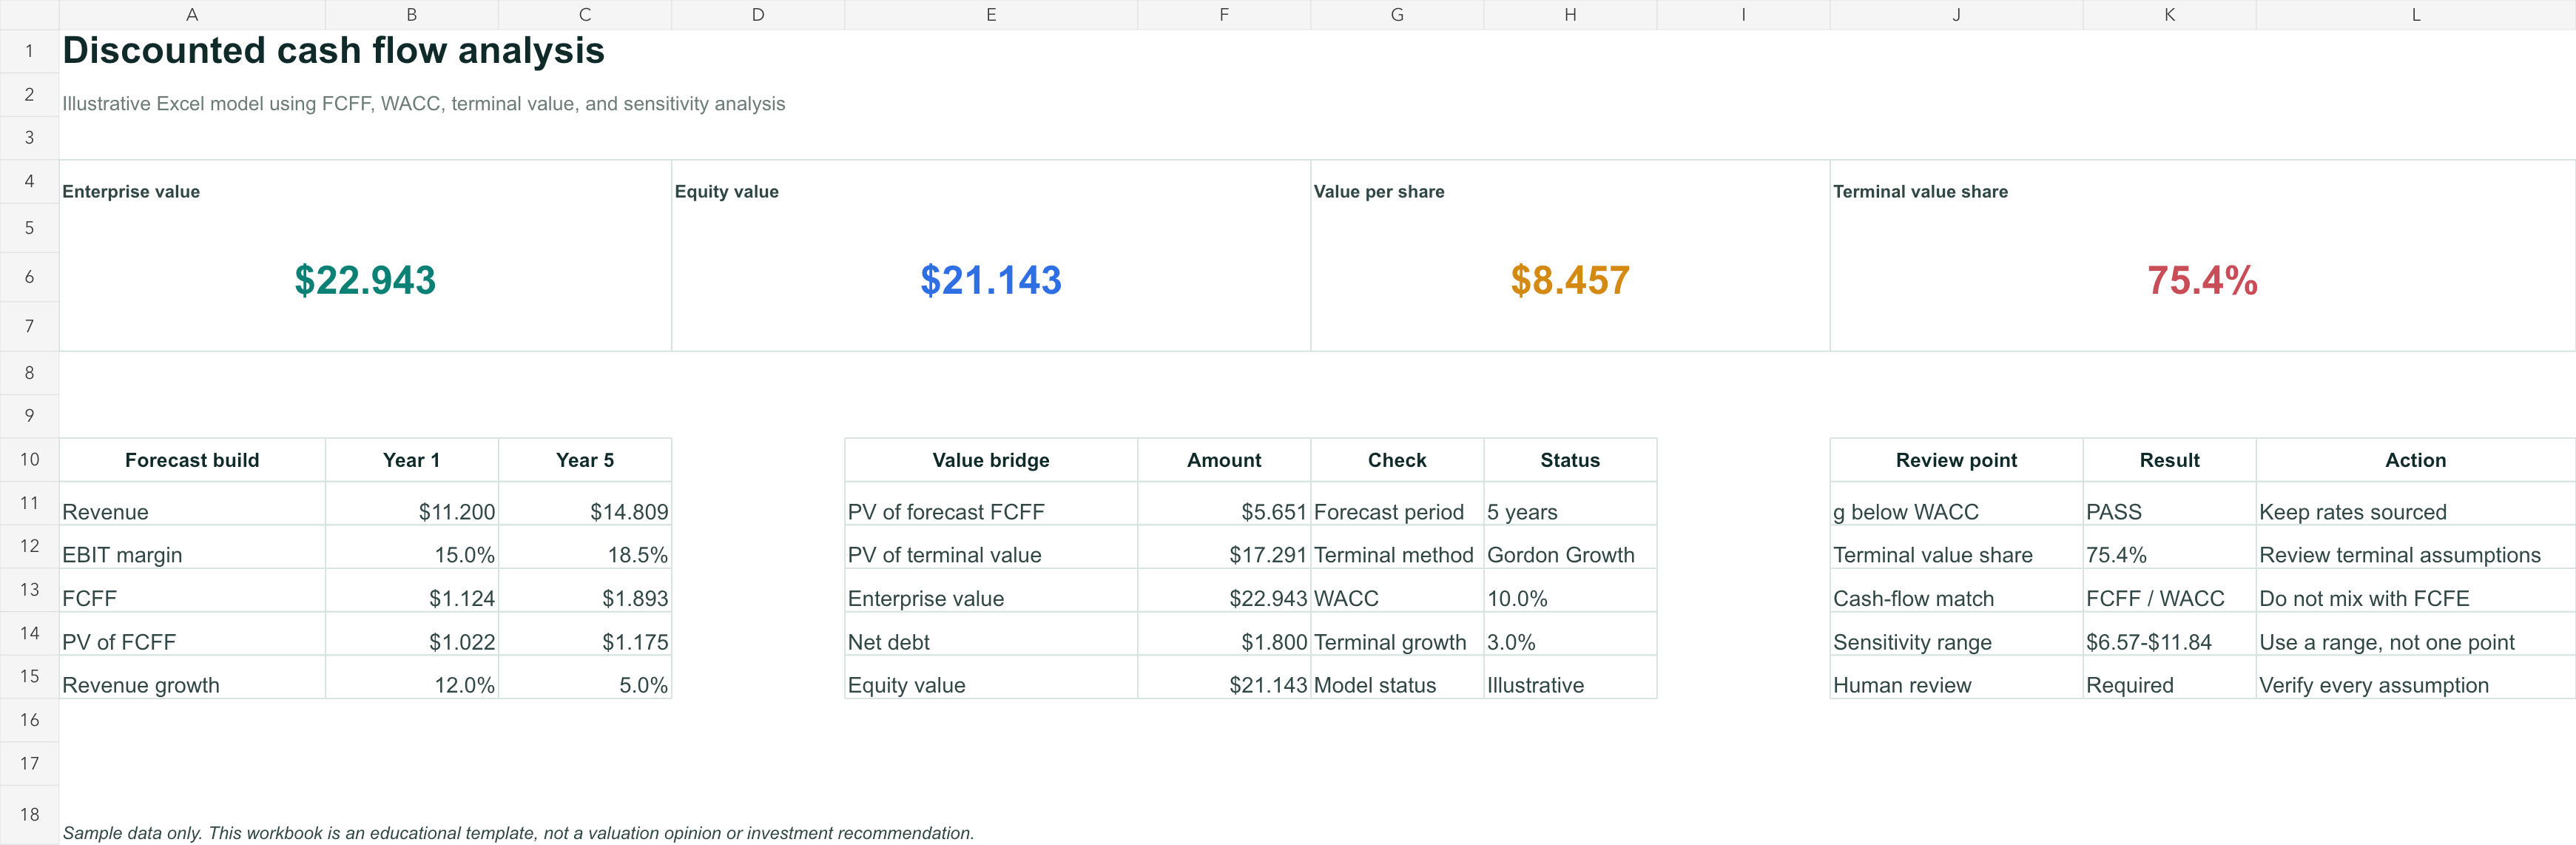
Illustrative sample data calculated in the downloadable workbook. Replace the yellow inputs and verify every assumption before using the result.
Direct answer
A discounted cash flow analysis values a business, asset, or project by estimating the cash it may generate in the future and converting those amounts into present value. A company DCF normally includes an explicit forecast period, free cash flow, a discount rate, terminal value, and adjustments that convert enterprise value into equity value.
The arithmetic can be built in Excel, but the result is only as reliable as the assumptions behind revenue growth, margins, reinvestment, discount rate, and long-term growth. A useful DCF is therefore not a single precise answer. It is a transparent range that lets reviewers see what must be true for a valuation to hold.
What is discounted cash flow analysis?
Investopedia defines discounted cash flow as a model that projects future cash flows and discounts them back to present value. The reason for discounting is straightforward: one dollar received today can be invested or used immediately, while one dollar expected several years from now carries both a delay and uncertainty.
The discount rate represents that time and risk. A cash flow expected soon and with relatively low uncertainty receives a smaller discount than a distant or risky cash flow. When every forecast cash flow has been converted to present value, the amounts can be added to estimate what the business or project is worth on the valuation date.
DCF is often described as an "intrinsic" valuation method because the result comes from the economics of the forecast rather than directly from a market multiple. That does not make it objective. Revenue growth, operating margins, reinvestment, capital structure, discount rate, and terminal value all require judgment.
DCF vs. cash flow analysis vs. NPV
Cash flow analysis and discounted cash flow analysis answer different questions. A cash flow review explains where cash came from, where it went, and whether the company can meet near-term obligations. A DCF projects future free cash flow to estimate value today.
A 13-week cash flow forecast, for example, focuses on weekly liquidity. It tracks collections, payroll, supplier payments, taxes, debt service, and ending cash. It can warn that cash may fall below a minimum threshold in week eight, but it is not designed to estimate the value of the entire company.
Net present value, or NPV, is closely related to DCF. For a project, the discounted value of future cash flows can be compared with the investment required today. Subtracting that initial investment produces NPV. A positive NPV indicates that the modeled return exceeds the selected discount rate, while a negative NPV indicates the opposite. It does not guarantee that the project will perform as forecast.
Which DCF model should you use?
The first modeling decision is not the discount rate. It is the cash flow being valued. The cash flow definition determines the appropriate discount rate and the meaning of the resulting value.
Project DCF
A project DCF isolates the incremental cash flows created by a specific decision, such as opening a location, purchasing equipment, developing software, or launching a product. Include cash flows that change because the project happens and exclude costs that would occur anyway.
The model should also include the initial investment, working capital requirements, operating cash flows, taxes, and any end-of-project proceeds. The discount rate should reflect the risk of those project cash flows rather than being selected only because it is the company's usual hurdle rate.
FCFF valuation
Free cash flow to the firm, or FCFF, is the cash generated by operations after taxes and required reinvestment but before payments to debt and equity investors. A common formulation is:
FCFF = EBIT x (1 - Tax Rate)
       + Depreciation and Amortization
       - Capital Expenditure
       - Change in Net Working Capital
FCFF is normally discounted at the weighted average cost of capital, or WACC. The result is enterprise value because the cash flow is available to all capital providers. Cash, debt, and other non-operating claims are handled later in the bridge from enterprise value to equity value.
FCFE valuation
Free cash flow to equity, or FCFE, measures cash available to common shareholders after operating needs, reinvestment, interest, and net borrowing. FCFE is discounted at the cost of equity, and the result is equity value directly.
The essential rule is to match the cash flow and discount rate. Professor Aswath Damodaran's valuation framework emphasizes that cash flow to the firm should be discounted at WACC, while cash flow to equity should be discounted at the cost of equity. Mixing FCFF with the cost of equity or FCFE with WACC changes the meaning of the calculation and biases the result.
This guide uses FCFF because it makes the operating forecast, capital structure, enterprise value, and equity bridge visible in one model.
What data do you need for a DCF model?
Start with historical financial statements. Two to three years of income statements, balance sheets, and cash flow statements usually provide enough context to inspect revenue growth, margins, tax rates, depreciation, capital expenditure, and working capital behavior. Longer histories may be useful for cyclical companies, but old averages should not override recent changes in the business.
Next, gather the operating assumptions behind the forecast. Revenue should be connected to drivers such as customers, units, price, retention, capacity, or market expansion. Costs should be separated into categories that scale with revenue and categories that follow contracts, headcount, or other operating drivers. A budget forecasting model can provide useful assumptions, but the DCF should document which forecast version it uses and when that forecast was approved.
The balance sheet matters because growth often requires cash before it produces cash. Higher receivables or inventory increase net working capital and reduce FCFF. Longer supplier terms can provide temporary funding, but they should not be extended indefinitely without an operational reason.
Finally, prepare the valuation inputs. These include the valuation date, forecast horizon, WACC or cost of equity, long-term growth rate, cash, debt, other non-operating assets or claims, and diluted share count. Market-based inputs should have a source and observation date. They should not be presented as timeless facts.
The discounted cash flow formula
The basic present-value formula is:
Present Value = CFt / (1 + r)^t
Here, CFt is the cash flow in period t, r is the discount rate, and t is the time between the valuation date and the cash flow. The DCF value is the sum of the present values of all forecast cash flows.
For a company valued with FCFF, the structure becomes:
Enterprise Value = Present Value of Forecast FCFF
                   + Present Value of Terminal Value
The model then converts enterprise value to equity value:
Equity Value = Enterprise Value
               + Cash and Non-operating Assets
               - Debt and Other Claims
The exact bridge depends on the company. Preferred stock, minority interests, pension deficits, leases, investments, or employee options may need separate treatment. If those items are not available, identify the limitation instead of inventing an adjustment.
How to build a DCF model in Excel
1. Define the valuation date and scope
State whether the model values a project, operating assets, the full enterprise, or common equity. Record the valuation date, reporting currency, unit scale, and whether cash flows occur at year-end or throughout the year.
This avoids a common source of silent errors. A model can be mathematically correct while mixing a December balance sheet, a March share count, and market inputs collected in September. The inputs need to describe the same valuation date or be adjusted deliberately.
2. Build the operating forecast
Forecast revenue first, then the costs required to produce it. A driver-based forecast is usually easier to defend than a flat percentage copied across every line. For example, revenue may depend on customer growth and average revenue per customer, while payroll depends on planned roles and start dates.
Continue the forecast through EBIT because FCFF begins with operating profit before financing costs. Keep interest expense outside the FCFF calculation. Financing is reflected in WACC and the enterprise-to-equity bridge; subtracting interest from FCFF would mix operating and financing effects.
3. Calculate NOPAT and FCFF
Net operating profit after tax, or NOPAT, can be calculated as:
=EBIT*(1-Tax_Rate)
Then calculate FCFF:
=NOPAT+Depreciation-CapEx-Change_in_NWC
Depreciation is added back because it reduced EBIT without using cash in the current period. Capital expenditure is subtracted because maintaining and expanding operating assets requires cash. An increase in net working capital is also subtracted because cash is tied up in receivables, inventory, or other operating balances.
4. Estimate the discount rate
For FCFF, the discount rate is normally WACC:
WACC = [E / (D + E) x Cost of Equity]
       + [D / (D + E) x Pre-tax Cost of Debt x (1 - Tax Rate)]
Use market-value weights where practical, and keep the currency and inflation basis consistent with the cash flow forecast. A nominal dollar forecast should not be discounted using a real rate, and a forecast in one currency should not be paired casually with a rate built from another currency.
WACC is an assumption, not an output that Excel or AI can declare correct. The model should show its components clearly enough for a qualified reviewer to challenge them.
5. Estimate terminal value
An explicit forecast rarely continues forever, so most company DCF models estimate the value of cash flows after the final forecast year. The Gordon Growth formula is:
Terminal Value = FCFFn x (1 + g) / (WACC - g)
FCFFn is the final forecast-year cash flow and g is the long-term growth rate. The growth rate must be lower than WACC. It should also be consistent with a mature business rather than the company's short-term expansion plan.
An exit-multiple approach applies a selected market multiple to a final-year measure such as EBITDA. It can be useful as a cross-check, but it introduces dependence on comparable-company pricing. Do not add the Gordon Growth result and the exit-multiple result together. They are alternative ways to estimate the same continuing value.
Terminal value is often a large share of enterprise value, which is why Harvard Business School Online's DCF guide stresses the sensitivity of a model to cash flow, discount rate, and long-term growth assumptions. If terminal value dominates the result, disclose the percentage and test a wider range of assumptions.
6. Discount the forecast cash flows and terminal value
If the year number is in column A, FCFF is in column H, and WACC is stored in cell B12, a year-end discounting formula can be written as:
=H2/(1+$B$12)^A2
The terminal value is measured at the end of the final forecast year, so it must also be discounted back to the valuation date. Adding an undiscounted terminal value to present-value cash flows overstates enterprise value.
Excel's NPV function assumes periodic end-of-period cash flows. XNPV uses actual dates and is more appropriate when timing is irregular. Microsoft's guidance on NPV and XNPV also notes that a time-zero cash flow is handled separately from the periodic values passed to NPV. Check the function's timing convention before relying on it.
7. Bridge enterprise value to equity value
Add excess cash and relevant non-operating assets, then subtract debt and other claims. Avoid using a generic enterprise value minus net debt shortcut unless the model has defined what belongs in net debt.
Divide the resulting equity value by diluted shares outstanding to estimate value per share. The share count should reflect the same valuation date and should account for relevant dilutive securities rather than using an unexplained basic share count.
A worked DCF example in Excel
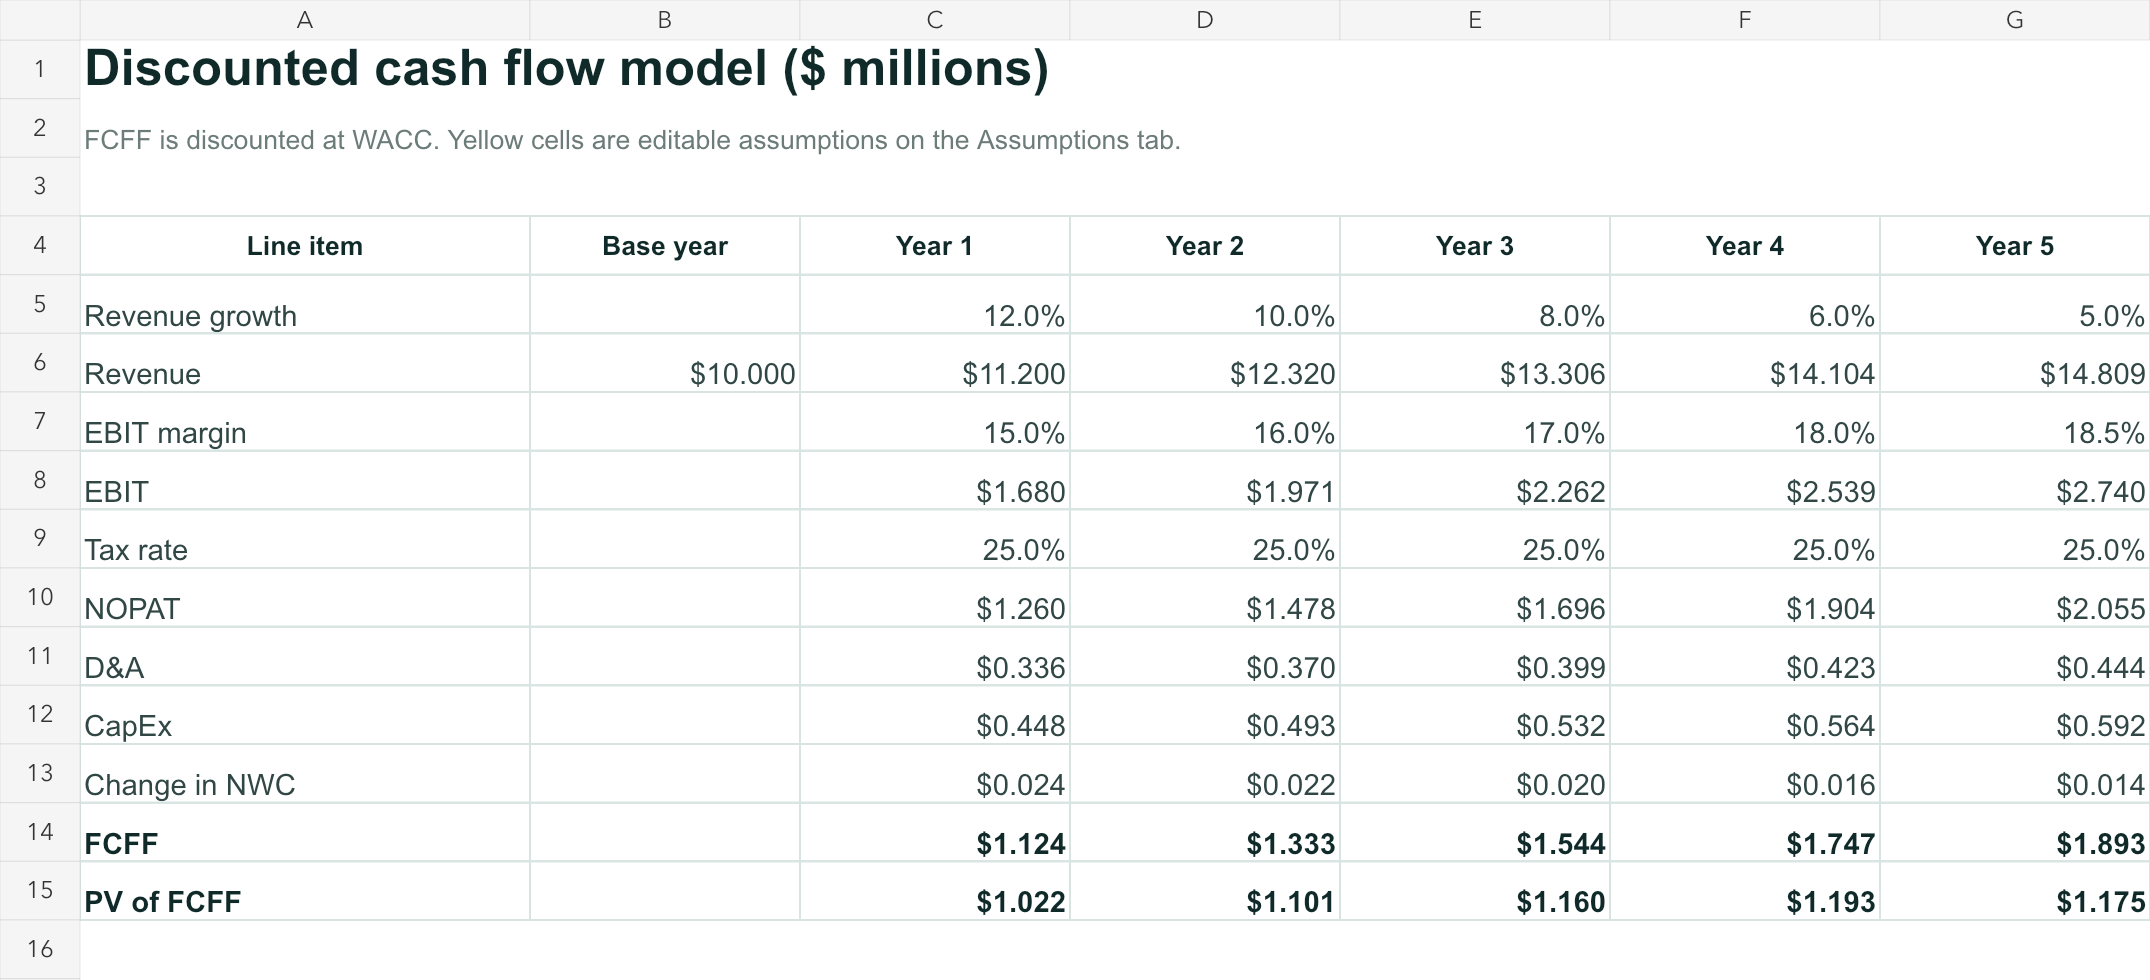
The image is rendered from the same downloadable Excel model used in the example below.
The following example uses a fictional company with $10.0 million of base-year revenue. Revenue growth slows from 12% in Year 1 to 5% in Year 5, while EBIT margin improves from 15.0% to 18.5%. The tax rate is 25%, depreciation is 3% of revenue, capital expenditure is 4% of revenue, and the increase in net working capital equals 2% of the annual revenue increase.
All figures except per-share value are in millions of dollars.
| Year | Revenue | EBIT | NOPAT | D&A | CapEx | Change in NWC | FCFF | PV of FCFF |
|---|---|---|---|---|---|---|---|---|
| 1 | $11.200 | $1.680 | $1.260 | $0.336 | $0.448 | $0.024 | $1.124 | $1.022 |
| 2 | $12.320 | $1.971 | $1.478 | $0.370 | $0.493 | $0.022 | $1.333 | $1.101 |
| 3 | $13.306 | $2.262 | $1.696 | $0.399 | $0.532 | $0.020 | $1.544 | $1.160 |
| 4 | $14.104 | $2.539 | $1.904 | $0.423 | $0.564 | $0.016 | $1.747 | $1.193 |
| 5 | $14.809 | $2.740 | $2.055 | $0.444 | $0.592 | $0.014 | $1.893 | $1.175 |
Using a 10.0% WACC and a 3.0% perpetual growth rate, terminal value is:
$1.893 x (1 + 3.0%) / (10.0% - 3.0%) = $27.848 million
Discounted back five years, the terminal value is $17.291 million. The present value of the five forecast cash flows is $5.651 million, producing an enterprise value of $22.943 million.
Assume the company has $1.2 million of cash, $3.0 million of debt, and 2.5 million diluted shares:
Equity Value = $22.943 + $1.200 - $3.000
             = $21.143 million

Value Per Share = $21.143 / 2.500
                = $8.46
The terminal value contributes about 75.4% of enterprise value in this example. That does not automatically invalidate the model, but it shows why the WACC and long-term growth assumptions deserve more attention than an apparently precise $8.46 output.
DCF sensitivity analysis: WACC vs. terminal growth
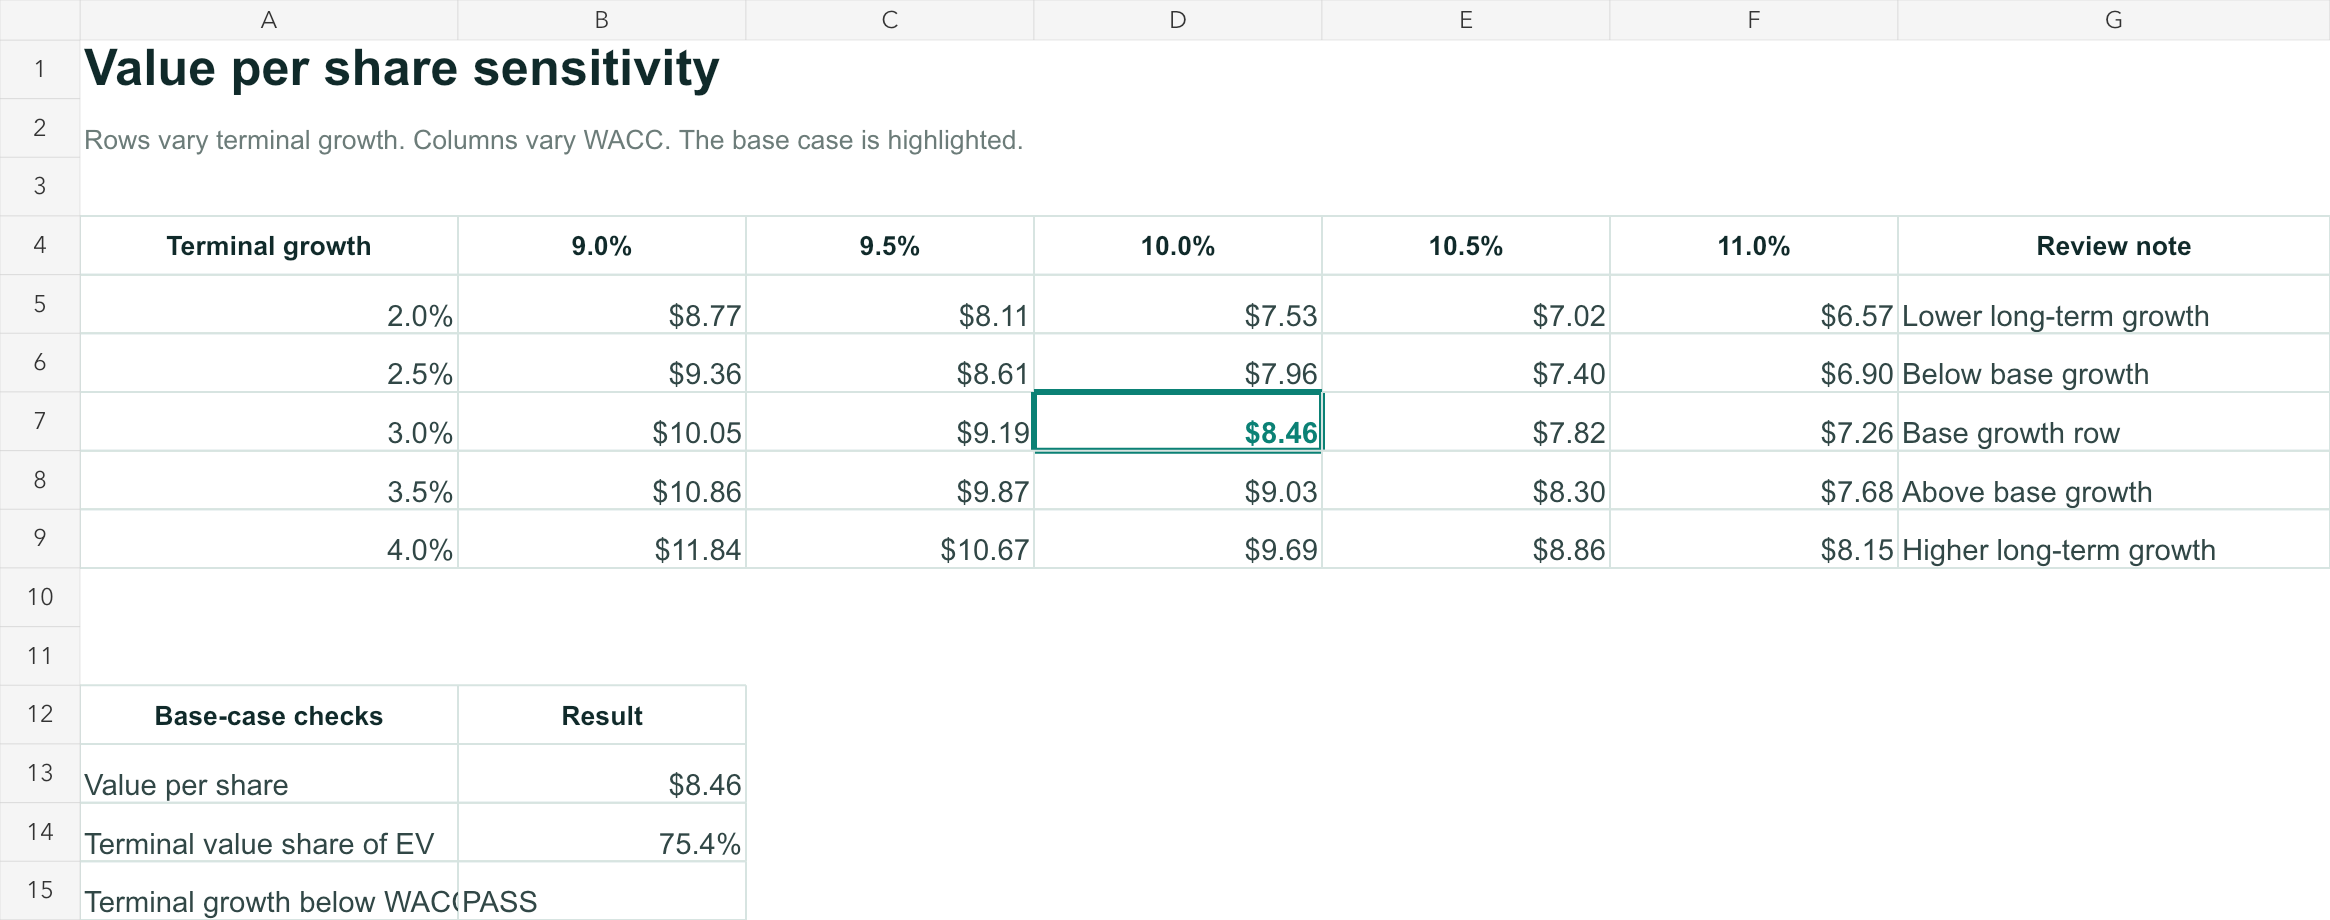
The highlighted cell is the 10.0% WACC and 3.0% terminal-growth base case.
A sensitivity analysis recalculates value across a reasonable range of WACC and terminal growth assumptions. This is more informative than publishing only the base case because the two assumptions often drive a large part of the valuation.
Using the same forecast, net debt, and diluted share count, the implied value per share changes as follows:
| Terminal growth | 9.0% WACC | 9.5% WACC | 10.0% WACC | 10.5% WACC | 11.0% WACC |
|---|---|---|---|---|---|
| 2.0% | $8.77 | $8.11 | $7.53 | $7.02 | $6.57 |
| 2.5% | $9.36 | $8.61 | $7.96 | $7.40 | $6.90 |
| 3.0% | $10.05 | $9.19 | $8.46 | $7.82 | $7.26 |
| 3.5% | $10.86 | $9.87 | $9.03 | $8.30 | $7.68 |
| 4.0% | $11.84 | $10.67 | $9.69 | $8.86 | $8.15 |
The range is not an error in the model. It is evidence that valuation depends on assumptions. Reviewers should ask whether each combination is economically coherent, not simply select the cell closest to a preferred answer.
Scenario analysis should also change operating drivers. A downside case might use slower customer growth, lower margins, and higher working capital requirements. An upside case might use stronger retention or operating leverage. Changing only WACC and terminal growth tests valuation assumptions; it does not replace a business forecast scenario.
How AI Sheets can help review uploaded DCF data
A DCF workbook often brings together historical statements, management forecasts, debt schedules, and valuation assumptions. The slow part is frequently not entering the present-value formula. It is aligning periods, labels, units, scenarios, and source data before a reviewer can trust the model.
With hiData AI Sheets, a finance team can upload relevant Excel or CSV files and use plain-language instructions to clean inconsistent labels, classify rows, compare forecast periods, flag unusual values, visualize scenario differences, and draft a review summary based on the uploaded data.
For example:
Compare the base, upside, and downside forecast files. Show where revenue growth,
EBIT margin, capital expenditure, or working capital assumptions differ. Do not
invent explanations that are not supported by the uploaded files.
Review the forecast table for missing periods, inconsistent units, duplicated
assumption rows, and unusual year-over-year movements. Return a list of items
that require finance review and identify the relevant source rows.
Summarize the five assumptions that have the largest visible effect on FCFF and
the valuation scenarios. Separate observations from hypotheses.
This workflow supports analysis from files the user provides. It does not claim that AI Sheets selects the correct WACC, audits workbook formulas, retrieves live market data, produces a professional valuation opinion, or makes an investment decision. Those judgments remain with qualified finance professionals.
The broader hiData finance workflow connects file preparation, spreadsheet analysis, visualization, and presentation. For DCF work, the practical use is preparing cleaner model inputs and a more reviewable explanation of the scenarios, not replacing the valuation process.
Common DCF modeling mistakes
Mixing cash flow and discount rate
Discounting FCFF at the cost of equity or FCFE at WACC changes the value and the type of claim being measured. Label the cash flow and discount rate prominently so the pairing can be reviewed before anyone discusses the output.
Forecasting profit instead of cash flow
EBIT, EBITDA, and net income are not free cash flow. A business can report growing profit while consuming cash through capital expenditure, inventory, or receivables. Reinvestment must remain visible in the model.
Forgetting to discount terminal value
Terminal value is calculated at the end of the explicit forecast period. It must be discounted back to the valuation date using the same timing convention as the forecast cash flows.
Using an unrealistic perpetual growth rate
The perpetual growth rate must be below the discount rate and should describe a mature business. A short-term growth target is rarely appropriate as a forever assumption.
Letting terminal value hide a weak forecast
A large terminal value can make an incomplete operating forecast look finished. Report terminal value as a percentage of enterprise value and explain why the company is expected to be in a stable state at the end of the explicit period.
Ignoring working capital
Growth often requires cash to fund receivables or inventory before customers pay. Omitting working capital can make an expanding company appear to generate more cash than its operations support.
Hard-coding assumptions inside formulas
Keep WACC, tax rate, long-term growth, margins, and other assumptions in visible input cells. Hard-coded numbers make review and scenario testing difficult and increase the risk of inconsistent updates.
Presenting one result as certainty
A DCF is a conditional estimate. Report the base case with a sensitivity range, important assumptions, and limitations instead of treating one calculated value as a fact.
DCF model review checklist
Before sharing the result, confirm that the valuation date, currency, and unit scale are stated. Historical and forecast periods should not overlap, and the forecast should use a documented version of management assumptions.
Check that FCFF is paired with WACC or FCFE is paired with the cost of equity. Confirm that taxes, depreciation, capital expenditure, and changes in net working capital are included with the correct sign.
Review the terminal value separately. The long-term growth rate must be lower than the discount rate, terminal value must be discounted, and the model should disclose how much of enterprise value comes from the terminal period.
Reconcile the enterprise-to-equity bridge to documented cash, debt, and other claims. Use a diluted share count when calculating per-share value, and record the source date for market-based inputs.
Finally, test the model with operating scenarios and a WACC-growth sensitivity matrix. A reviewer who did not build the workbook should be able to trace the important assumptions and understand why the valuation changes.
Limitations of discounted cash flow analysis
DCF becomes less reliable when future cash flows are difficult to estimate. Early-stage companies, cyclical businesses, restructurings, commodity producers, and companies facing major regulatory or technological change may have especially wide valuation ranges.
The model is also vulnerable to false precision. Adding more rows and decimal places does not improve an unsupported revenue forecast or discount rate. The quality of the assumptions matters more than the visual complexity of the workbook.
Terminal value can dominate the answer, and small changes in WACC or long-term growth can produce large changes in value. That is why DCF should usually be considered alongside other evidence, such as comparable-company multiples, precedent transactions, asset values, strategic context, and management's ability to execute the forecast.
DCF remains useful because it forces the analyst to connect value with cash generation, reinvestment, risk, and time. Its purpose is not to remove judgment. Its purpose is to make that judgment visible enough to challenge.
Frequently asked questions
How does discounted cash flow analysis work?
Discounted cash flow analysis estimates present value by forecasting future cash flows and discounting them at a rate that reflects time and risk. A company DCF normally includes an explicit forecast, terminal value, and an enterprise-to-equity value bridge.
How many years should a DCF forecast cover?
Five to ten years is common, but the appropriate period depends on how long the business needs to reach a stable operating state. A shorter forecast may miss important changes, while a longer forecast can create unsupported precision.
What discount rate should be used in a DCF?
The rate must match the cash flow. FCFF is normally discounted at WACC, while FCFE is discounted at the cost of equity. Project cash flows may require a rate that reflects the risk of the specific project.
What is terminal value?
Terminal value estimates the value of cash flows after the explicit forecast period. It is commonly calculated using a perpetual-growth formula or an exit multiple and then discounted back to the valuation date.
Is DCF the same as NPV?
They are related but not identical. DCF is the process of discounting expected future cash flows. For a project, NPV normally subtracts the initial investment from the present value of those future cash flows.
Can Excel perform a DCF analysis?
Yes. Excel can forecast cash flows, apply discount factors, calculate terminal value, build an enterprise-to-equity bridge, and run sensitivity analysis. The user still needs to select and verify the underlying financial assumptions.
Can AI build a DCF model automatically?
AI can help clean uploaded data, compare scenarios, flag unusual values, visualize changes, and draft summaries. It should not invent missing inputs, select the correct discount rate without support, or replace professional valuation judgment.
What is the biggest weakness of DCF?
The result can be highly sensitive to forecasts, WACC, and terminal growth. Those inputs are estimates, so a DCF should be presented as a range with transparent assumptions rather than a guaranteed value.
Review your DCF data with hiData AI Sheets
Upload your historical financial statements, operating forecast, and valuation scenarios to AI Sheets to organize assumptions, compare forecast versions, surface unusual changes, and prepare a review summary from the files you provide.