When cash gets tight, a monthly P&L forecast is too slow.
A supplier payment due next Friday, a payroll run in week four, a delayed customer collection, and a debt payment in week nine can all change the company’s real room to maneuver. The leadership question is not only whether the business will be profitable this quarter. It is whether the business will have enough cash, in the right account, on the exact week cash is needed.
That is why finance and treasury teams use a 13-week cash flow forecast.
A 13-week cash flow forecast is a rolling, week-by-week projection of cash inflows and cash outflows over the next quarter. It starts with the opening cash balance, adds expected receipts, subtracts expected payments, and shows the closing cash balance for each of the next 13 weeks.
Quick answer: A 13-week cash flow forecast helps a company see whether it can cover near-term obligations such as payroll, supplier payments, rent, taxes, debt service, and operating expenses. It is usually built with the direct method, updated weekly, and reviewed against actual cash movement to improve accuracy.
This guide explains how the 13-week cash flow model works, what data belongs in it, when teams use it, how to build one from spreadsheet exports, and how AI can help finance teams review the model faster.
For the wider planning context, the AI for FP&A guide shows how short-term cash planning fits with forecasting, variance analysis, scenarios, and management reporting.
Last updated: August 20, 2026.
Key takeaways
- The 13-week cash flow forecast is a short-term liquidity model. It shows weekly cash receipts, payments, net cash flow, and ending cash balance across a rolling quarter.
- The model uses cash timing, not accrual accounting. Revenue only matters when cash is expected to be collected. Expenses only matter when cash is expected to leave the bank.
- Thirteen weeks is useful because it balances accuracy and action. It is short enough for detailed forecasting and long enough to respond before a shortfall becomes urgent.
- The most important inputs are opening cash, AR collections, AP payments, payroll, taxes, debt service, capex, and one-time cash items.
- A useful forecast includes variance analysis. Each week, compare actual cash movement to the forecast and adjust the assumptions that are repeatedly wrong.
- AI is most useful after data is structured. It can help clean exports, classify transactions, explain variance, identify risky weeks, and create a cash review pack.
What is a 13-week cash flow forecast?
A 13-week cash flow forecast is a weekly cash model that projects the company’s cash position for the next 13 weeks.
The model usually follows a simple structure:
| Forecast line | What it means |
|---|---|
| Opening cash balance | Cash available at the beginning of the week |
| Cash inflows | Expected customer collections, cash sales, loan proceeds, transfers, refunds, or other receipts |
| Cash outflows | Expected supplier payments, payroll, rent, taxes, debt service, capex, and operating disbursements |
| Net cash flow | Total inflows minus total outflows for the week |
| Closing cash balance | Opening cash plus or minus net cash flow |
At the end of each week, the model rolls forward. The completed week is replaced with actual cash movement, the forecast assumptions are updated, and a new week is added to keep the forecast horizon at 13 weeks.
That rolling structure matters. A forecast created once and left untouched becomes stale quickly. A rolling forecast becomes part of the weekly operating rhythm.
Why 13 weeks?
Thirteen weeks is roughly one quarter. That horizon is long enough to show upcoming pressure points, but short enough for finance teams to forecast with useful detail.
A two-week cash view may be accurate, but it gives the company limited time to act. If the model shows a shortfall next Friday, the options are already narrow. A six- or twelve-month forecast gives broader strategic context, but it usually depends on higher-level assumptions that are less reliable for weekly cash decisions.
A 13-week model sits between those two extremes:
- It gives treasury enough time to arrange financing, delay spending, accelerate collections, or plan payment timing.
- It gives operators enough detail to see when payroll, inventory purchases, rent, taxes, and supplier payments collide.
- It gives lenders, investors, and boards a familiar short-term liquidity view.
- It aligns naturally with quarterly reporting and short-term working capital management.
The point is not that 13 weeks is mathematically perfect. The point is that it creates a practical operating window: detailed enough to manage the next few weeks and broad enough to prepare for the end of the quarter.
13-week cash flow forecast vs monthly cash forecast
Monthly cash forecasts are useful for planning. Weekly cash forecasts are useful for control.
| Area | Monthly cash forecast | 13-week cash flow forecast |
|---|---|---|
| Time period | Often 6 to 12 months | 13 weeks |
| Granularity | Monthly | Weekly |
| Best use | Budget planning, board reporting, long-range runway | Liquidity management, payment timing, short-term decisions |
| Main risk | Hides timing problems inside a month | Requires more frequent updates |
| Common inputs | Budget, P&L forecast, balance sheet assumptions | Bank balances, AR, AP, payroll, debt, tax, capex, known cash events |
For example, a monthly forecast may show that May ends with enough cash. But the 13-week forecast may show that cash goes negative in the second week of May before a large customer payment arrives in week four.
That difference matters. Payroll, rent, and debt payments do not wait for the month-end average.
Direct method vs indirect method
Most 13-week cash flow forecasts use the direct method.
The direct method forecasts actual cash receipts and actual cash payments. It asks:
- Which customers are expected to pay this week?
- Which suppliers will be paid this week?
- When does payroll leave the bank?
- Which tax, rent, debt, or capex payments are scheduled?
- What one-time cash events should be included?
The indirect method starts with profitability metrics such as net income or EBITDA and adjusts for non-cash items and working capital movement. That can be useful for longer-range planning, but it is less precise for short-term liquidity.
For a 13-week cash flow model, finance teams need the direct view because near-term cash risk is about timing. A sale booked today may not turn into cash for 45 days. A vendor invoice recorded last month may become a bank payment this Friday.
Who uses a 13-week cash flow forecast?
The 13-week format is common in restructuring, but it is not only for distressed companies.
Treasury teams
Treasury uses the forecast to monitor liquidity, plan transfers, manage short-term borrowing, optimize working capital, and decide whether surplus cash can be invested safely.
CFOs and finance leaders
CFOs use the forecast to explain cash runway, payment timing, collection risk, covenant pressure, and the financial effect of operating decisions.
Founders and operators
Founders use the model when runway is tight or cash timing is unpredictable. It helps answer whether the company can hire, buy inventory, pay vendors, or survive a delayed customer payment.
Restructuring and turnaround teams
Advisors use the 13-week forecast to show liquidity under pressure, support lender discussions, evaluate DIP financing needs, and track whether management has a credible cash plan.
Lenders and investors
External stakeholders often ask for a 13-week cash flow forecast because it shows whether the business understands its near-term cash position and can explain the assumptions behind it.
What data belongs in a 13-week cash flow model?
Start with the data that changes cash in the bank.
| Data source | Common fields | Forecast use |
|---|---|---|
| Bank balances | account, entity, currency, date, available balance | Opening cash and cash position validation |
| Accounts receivable | customer, invoice number, due date, amount, status, promised payment date | Forecast customer collections |
| Sales pipeline or bookings | customer, expected close, billing date, collection assumption | Estimate future receipts not yet in AR |
| Accounts payable | vendor, invoice number, due date, amount, approval status, payment priority | Forecast supplier payments |
| Payroll | pay date, gross pay, tax, benefits, bonus, contractor payment | Forecast recurring labor cash outflows |
| Debt schedule | lender, interest date, principal date, fee, covenant date | Forecast debt service and borrowing needs |
| Tax schedule | tax type, due date, estimated amount | Forecast tax payments |
| Capex and projects | project, vendor, milestone, payment date, amount | Forecast large non-routine payments |
| One-time events | refund, insurance proceeds, settlement, asset sale, financing, intercompany transfer | Separate unusual cash movement from normal operations |
The data does not need to be perfect before the first forecast. But it does need to be structured enough to answer three questions:
- When will cash arrive?
- When will cash leave?
- Which weeks fall below the minimum cash threshold?
A simple 13-week cash flow forecast structure
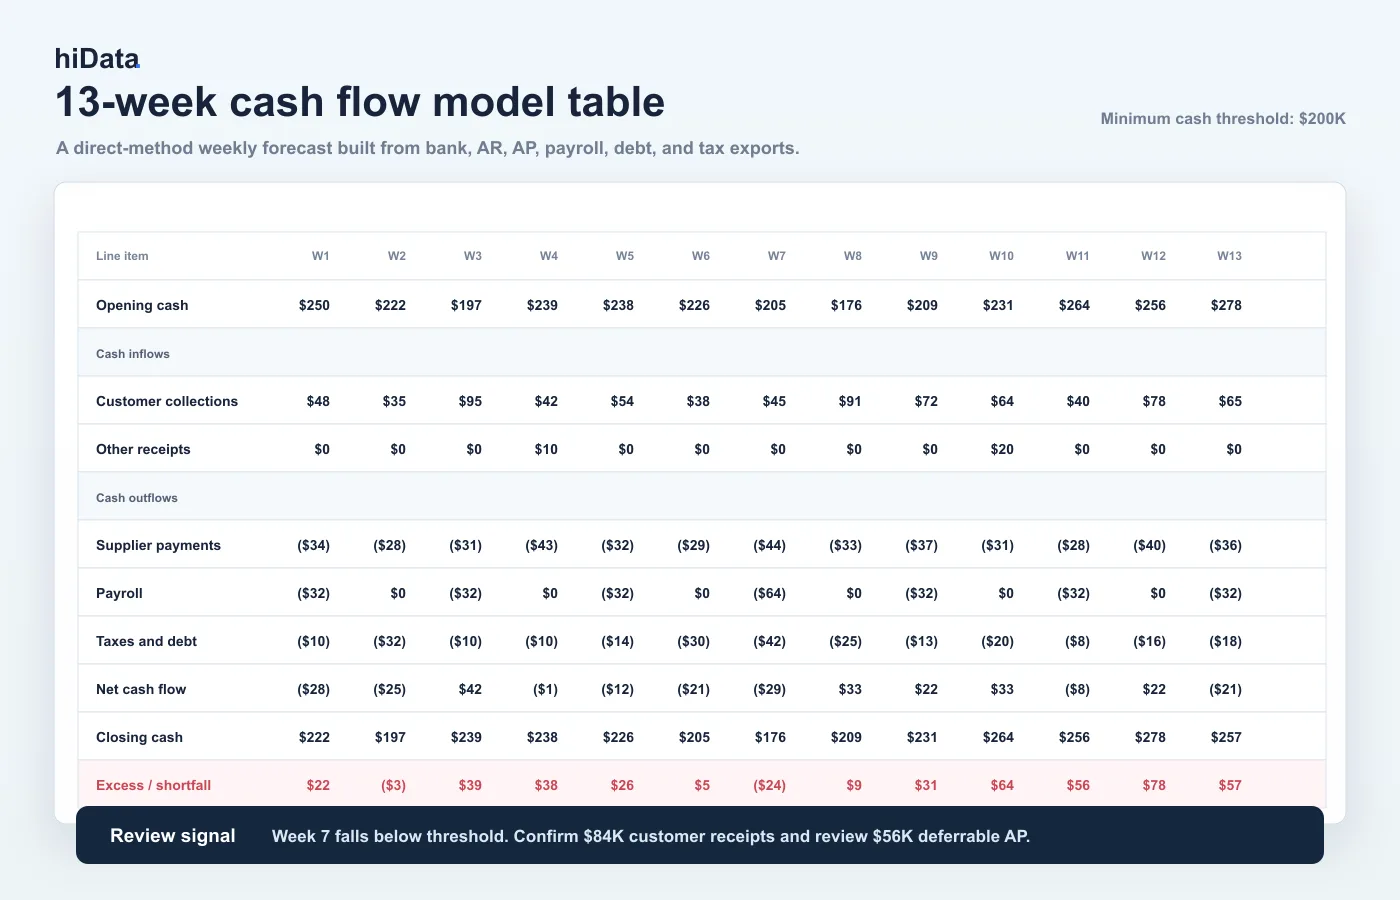
A weekly grid makes the closing-cash line, and its low point, readable at a glance.
Most models can start with this layout:
| Line item | Week 1 | Week 2 | Week 3 | Week 4 |
|---|---|---|---|---|
| Opening cash | $250,000 | $222,000 | $197,000 | $239,000 |
| Customer collections | $48,000 | $35,000 | $95,000 | $42,000 |
| Other receipts | $0 | $0 | $0 | $10,000 |
| Total inflows | $48,000 | $35,000 | $95,000 | $52,000 |
| Supplier payments | ($34,000) | ($28,000) | ($31,000) | ($43,000) |
| Payroll | ($32,000) | $0 | ($32,000) | $0 |
| Rent and utilities | ($10,000) | $0 | $0 | ($10,000) |
| Debt service | $0 | ($18,000) | $0 | $0 |
| Total outflows | ($76,000) | ($60,000) | ($53,000) | ($53,000) |
| Net cash flow | ($28,000) | ($25,000) | $42,000 | ($1,000) |
| Closing cash | $222,000 | $197,000 | $239,000 | $238,000 |
The full model would continue through week 13. Many teams also add a minimum cash line:
Excess / shortfall = closing cash - minimum cash requirement
If the company needs at least $200,000 of cash on hand, week 2 is the first warning point in the example above. The closing balance is not negative, but it is below the operating cushion.
That is a better conversation than waiting until the bank account is nearly empty.
How to build a 13-week cash flow forecast
1. Define the scope
Decide which entities, accounts, currencies, and business units belong in the forecast.
For a small business, the scope may be one operating bank account. For a multi-entity company, the scope may include several subsidiaries, restricted cash accounts, intercompany transfers, and currencies.
Be explicit about what is excluded. If payroll is paid from a separate account, or if one entity has restricted cash, the model should not pretend all cash is equally available.
2. Reconcile opening cash
The opening cash balance should come from actual bank data, not an old spreadsheet number.
Before forecasting forward, check:
- Are all operating bank accounts included?
- Are uncleared checks or pending transactions handled consistently?
- Are restricted cash balances separated?
- Are foreign currency balances converted with the right rate?
- Does the cash balance tie to the latest bank statement or bank feed?
If opening cash is wrong, every week after it will be wrong.
3. Forecast cash inflows
Cash inflows usually start with accounts receivable.
For each open customer invoice, estimate the expected collection week. Due date is useful, but payment behavior is often more useful. Some customers pay early. Some pay 15 days late. Some pay only after a reminder.
Common inflow categories include:
- Customer collections from open invoices
- Expected cash sales
- Deposits or prepayments
- Refunds or rebates
- Loan draws
- Asset sale proceeds
- Insurance proceeds
- Intercompany receipts
For uncertain receipts, avoid hiding risk inside one number. Use categories such as committed, expected, and uncertain, or create base and downside scenarios.
4. Forecast cash outflows
Cash outflows usually begin with AP, payroll, debt, taxes, and fixed operating payments.
For supplier payments, finance should review more than the due date. Payment timing may depend on approval status, vendor priority, dispute status, purchase order matching, cash availability, and payment terms.
Common outflow categories include:
- Supplier invoices
- Payroll and contractor payments
- Rent and utilities
- Insurance
- Taxes
- Debt interest and principal
- Software renewals
- Inventory purchases
- Capital expenditures
- Legal, restructuring, or advisory fees
- Intercompany payments
The goal is not to pay everything as late as possible. The goal is to see which payment decisions protect operations, supplier relationships, and liquidity.
5. Add non-routine cash items
One-time cash events can distort the model if they are mixed into normal operating categories.
Examples include:
- A large annual insurance payment
- A legal settlement
- A tax refund
- A one-time bonus
- A financing fee
- A warehouse move
- A major equipment purchase
- A customer prepayment
- A vendor catch-up payment
Flag these separately so the team can tell the difference between a recurring cash pattern and a one-time event.
6. Calculate weekly closing cash
For each week:
Opening cash + total cash inflows - total cash outflows = closing cash
Then the closing cash balance becomes the next week’s opening cash balance.
Add a minimum cash threshold if the business has one. This may be based on payroll coverage, lender requirements, operating policy, or management preference.
7. Review the low points
The most important output is not the final week. It is the lowest cash week.
Ask:
- Which week has the lowest closing cash balance?
- Does any week fall below the minimum cash threshold?
- Which inflows are assumed before that low point?
- Which payments are optional, deferrable, or negotiable?
- What decision has to happen this week to improve that future week?
The forecast becomes useful when it changes today’s action.
8. Compare forecast to actuals every week
Variance analysis is what makes the model better over time.
Each week, compare forecasted inflows and outflows to actual bank movement:
| Variance question | Example |
|---|---|
| Did cash arrive later than expected? | A customer promised payment in week 2 but paid in week 4 |
| Did payments happen earlier than expected? | A vendor was paid immediately because of a service hold |
| Was the amount wrong? | Payroll taxes were higher than estimated |
| Was the item missing? | A software renewal was not included |
| Was the category wrong? | A capex payment was grouped as normal supplier spend |
Then update the assumptions. If one customer is always late, the next forecast should reflect that behavior. If a vendor always requires prepayment, the model should not assume standard terms.
Practical use cases for a 13-week cash flow forecast
Cash runway planning
The forecast helps founders and CFOs see how many weeks the business can operate before cash drops below the minimum threshold.
This is especially useful when revenue is seasonal, fundraising is pending, or the business is balancing growth investment with cash discipline.
Payroll coverage
Payroll is often the most sensitive cash obligation. A 13-week model shows whether payroll dates collide with slow collection weeks, tax payments, or large supplier disbursements.
AP payment timing
Finance can use the forecast to prioritize which supplier payments should be released, delayed, disputed, or escalated.
This connects naturally with invoice processing: AP needs to know which invoices are approved, matched, on hold, or ready to pay before the cash forecast can be trusted.
AR collections focus
The model shows which customer collections matter most before a low-cash week.
Instead of chasing every overdue invoice equally, AR can focus on the receipts that change the forecasted cash balance.
Inventory and purchase commitments
Businesses that buy inventory need to see the cash effect of purchase orders before goods are sold.
This connects with purchase order management: open POs, supplier terms, deposits, and delivery schedules can all become future cash outflows.
Debt service and lender reporting
Companies with debt need to forecast interest, principal, covenant dates, revolver availability, and potential borrowing needs.
In restructuring or turnaround situations, the 13-week model often becomes a central reporting tool because it shows whether the business has enough liquidity to keep operating.
Scenario planning
A base forecast is helpful. A downside forecast is often more useful.
Scenario examples:
- A major customer pays two weeks late.
- Payroll increases after new hires start.
- A supplier requires advance payment.
- Revenue is 10% lower than expected.
- A lender draw is delayed.
- Inventory purchases must happen earlier than planned.
The value is not guessing the future. The value is knowing which assumptions create real cash risk.
Common mistakes to avoid
Using revenue instead of collections
Revenue is not cash. A 13-week cash flow forecast should reflect when the company expects to receive money, not when it earns revenue under accrual accounting.
Ignoring payment approval status
An AP invoice due this week may not actually be paid if it is missing approval, under dispute, or waiting for goods receipt.
The model should separate scheduled payments from approved payments.
Hiding one-time items in normal categories
If a one-time legal settlement is grouped with regular operating disbursements, the team may think the run rate is worse than it is.
Forgetting tax, debt, and payroll timing
These payments can create sharp cash dips. They should be scheduled explicitly, not estimated from monthly averages.
Updating the model irregularly
A stale 13-week forecast creates false confidence. Weekly roll-forward is the discipline that keeps the model alive.
Building too much detail too early
A model with hundreds of lines can look sophisticated and still be hard to maintain.
Start with the categories that drive decisions. Add detail where variance or risk justifies it.
How AI can help with 13-week cash flow forecasting
AI does not replace treasury judgment. It helps finance teams move faster from messy files to reviewable cash insight.
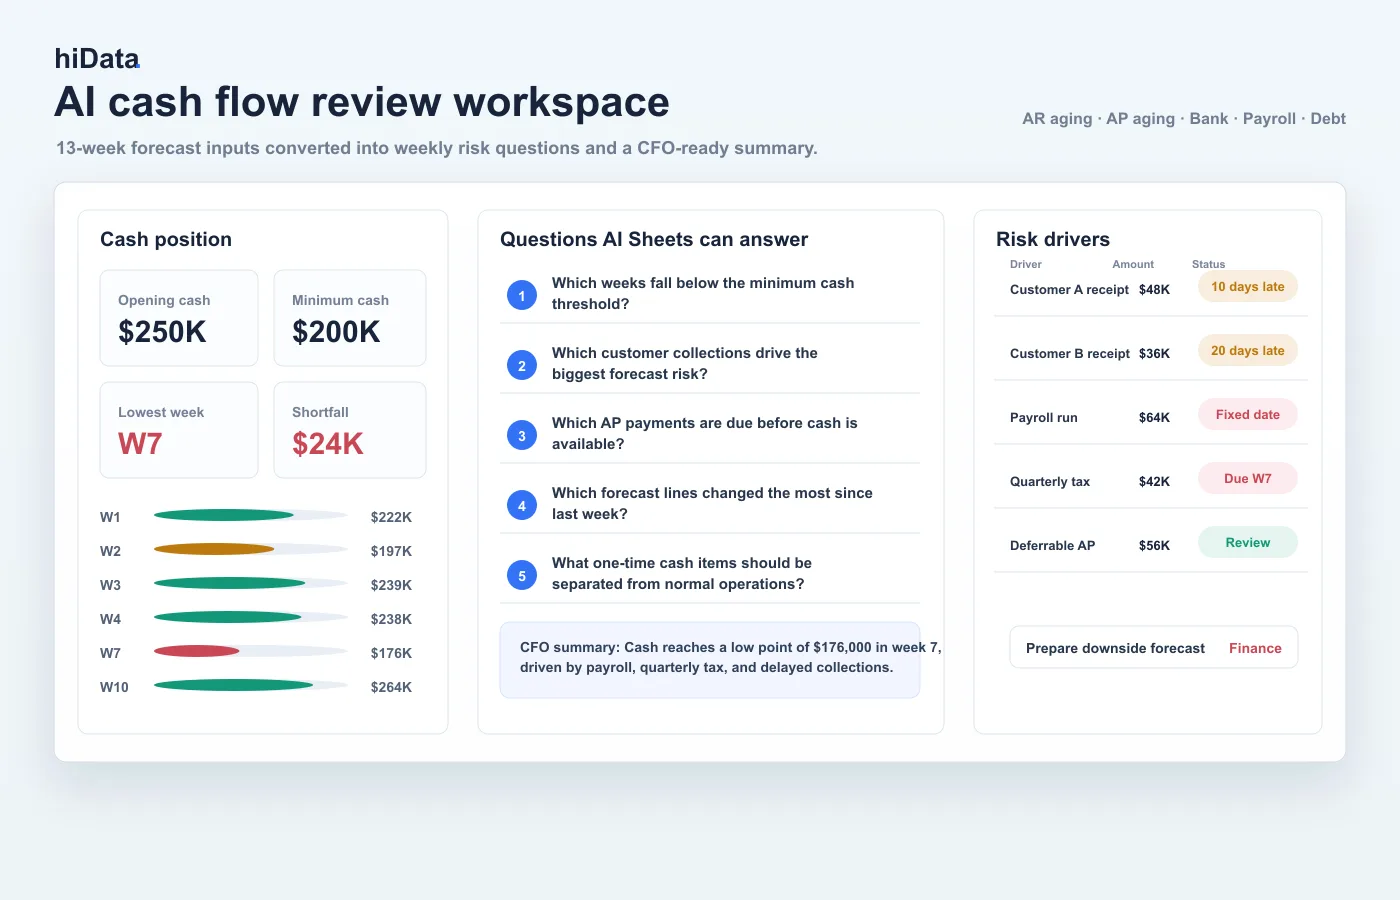
With hiData AI Sheets, teams can upload exported AR aging, AP aging, bank transactions, payroll schedules, debt schedules, and forecast workbooks, then ask questions such as:
- Which weeks fall below the minimum cash threshold?
- Which customer collections drive the biggest forecast risk?
- Which AP payments are due before cash is available?
- Which vendors have large payments in the next 13 weeks?
- Which forecast lines changed the most since last week?
- Which actuals missed the forecast by more than 10%?
- What one-time cash items should be separated from normal operations?
- Build a cash review summary for the CFO.
AI is especially useful for:
| Task | How AI helps |
|---|---|
| Data cleaning | Standardizes vendor names, customer names, dates, categories, and currencies |
| Forecast mapping | Groups bank, AR, AP, payroll, and debt data into weekly inflow and outflow categories |
| Variance review | Compares actual cash movement with forecast assumptions |
| Risk detection | Flags weeks below minimum cash, large uncertain receipts, and payment clusters |
| Review pack creation | Summarizes cash runway, low points, drivers, assumptions, and recommended actions |
The strongest workflow is still human-led. Finance owns the assumptions, priorities, and decisions. AI helps organize the data and surface the questions worth asking.
Example: weekly cash review summary
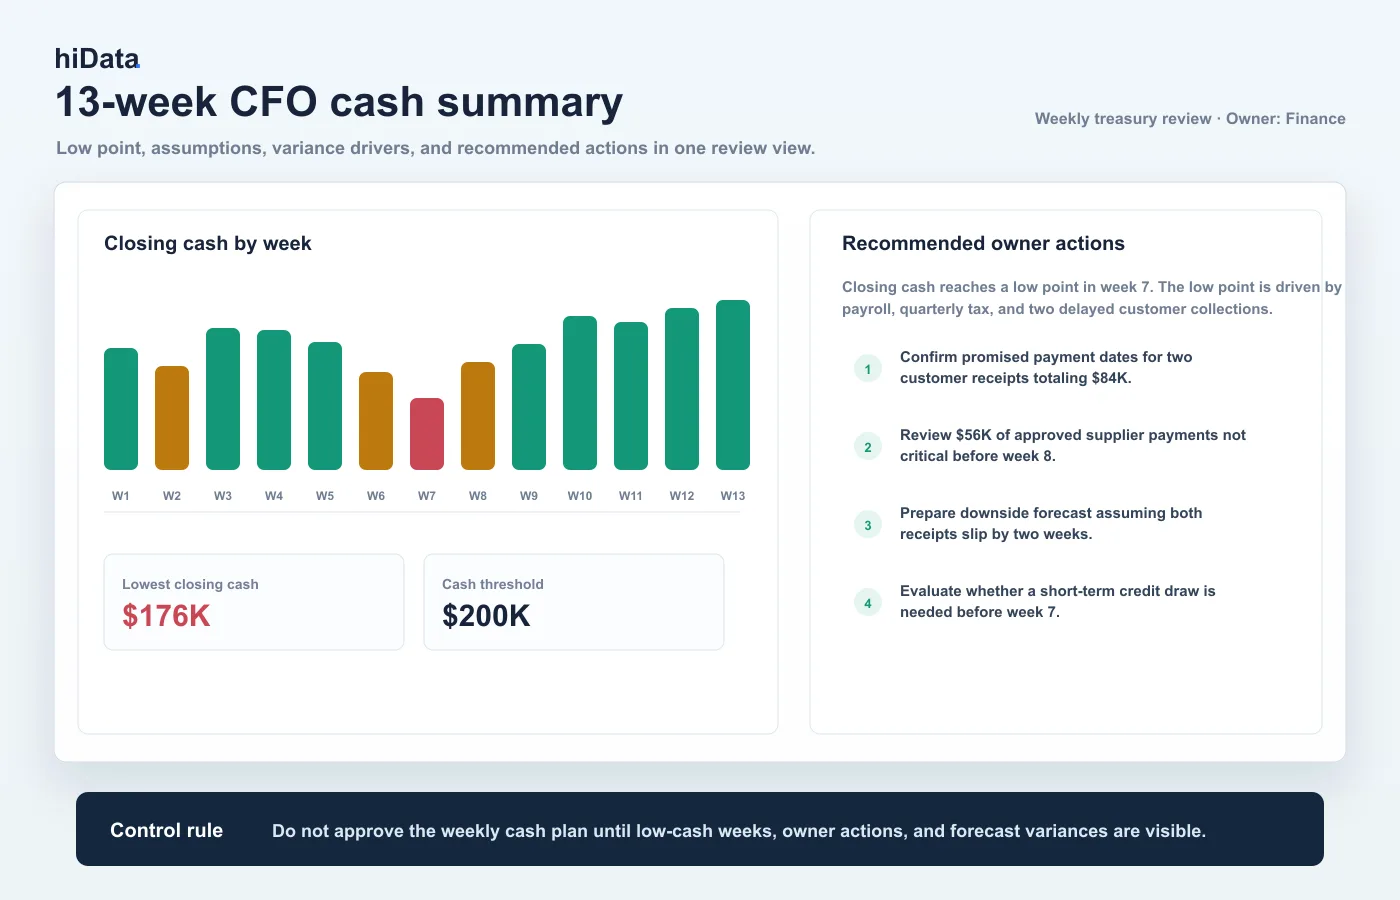
The review output worth circulating is the one that names a low point, an owner, and a rule.
Imagine the 13-week forecast shows the company will fall below its $200,000 minimum cash threshold in week 7.
A useful CFO review summary might say:
- Closing cash reaches a low point of $176,000 in week 7.
- The low point is driven by payroll, a quarterly tax payment, and a delayed customer collection.
- Two customer receipts totaling $84,000 are assumed before the low point, but both customers have historically paid 10 to 20 days late.
- AP includes $56,000 of supplier payments that are approved but not operationally critical before week 8.
- If the two customer receipts slip by two weeks, closing cash falls to $92,000.
- Recommended actions: confirm customer payment dates, review supplier payment timing, prepare a downside forecast, and evaluate whether a short-term credit draw is needed.
That is the point of the model. It turns cash data into an operating conversation before the problem arrives.
13-week cash flow forecast checklist
Before relying on the model, review this checklist:
- Opening cash ties to bank data.
- Restricted cash is separated from available cash.
- AR collection timing is based on customer behavior, not only due dates.
- AP payments reflect approval status, payment priority, and holds.
- Payroll, taxes, rent, debt service, and capex are scheduled explicitly.
- One-time cash items are flagged separately.
- Minimum cash threshold is visible.
- Base and downside scenarios are available.
- Actuals are compared to forecast every week.
- Assumption changes are documented with an owner and date.
FAQ
What is a 13-week cash flow forecast?
A 13-week cash flow forecast is a rolling weekly model that projects cash inflows, cash outflows, net cash flow, and ending cash balance across the next 13 weeks.
Why do companies use a 13-week cash flow forecast?
Companies use it to manage short-term liquidity, spot cash shortfalls early, plan payments, focus collections, support lender reporting, and make operating decisions based on weekly cash timing.
Is a 13-week cash flow forecast direct or indirect?
Most 13-week cash flow forecasts use the direct method because they forecast actual cash receipts and payments. This is more useful for near-term liquidity than a P&L-based indirect forecast.
How often should a 13-week forecast be updated?
Weekly is the standard. The completed week should be replaced with actuals, assumptions should be refreshed, and a new week should be added to the end of the model.
What are the main components of a 13-week cash flow model?
The main components are opening cash, cash inflows, cash outflows, net cash flow, closing cash, and often a minimum cash threshold or excess cash line.
What is the difference between a 13-week cash forecast and a budget forecast?
A budget forecast usually updates expected revenue, expenses, and financial performance over months or quarters. A 13-week cash forecast focuses on weekly cash movement and short-term liquidity.
Who should own the 13-week cash flow forecast?
Treasury or finance usually owns the model, but inputs often come from AR, AP, payroll, operations, sales, tax, and leadership.
Can AI build a 13-week cash flow forecast?
AI can help structure data, classify transactions, summarize variance, identify risky weeks, and draft review notes. Finance teams should still validate the assumptions, source data, and final decisions.
Final thought
A 13-week cash flow forecast is not just a spreadsheet. It is a weekly decision system.
When the model is maintained well, finance can see the low point before it arrives, understand which assumptions matter, and give leaders a practical set of choices: accelerate collections, adjust payments, delay spending, arrange financing, or change the operating plan.
The best forecast is not the most complicated one. It is the one the team updates every week, trusts enough to discuss, and uses early enough to act.
If your team already builds the forecast from bank, AR, AP, and payroll files, hiData AI Sheets can help turn those exports into a weekly cash review - Analyze your cash flow forecast with AI Sheets.
Sources reviewed
- Ripple Treasury, "What is 13-Week Cash Flow Forecasting?"
- Financial Edge Training, "13-Week Cash Flow Model (TWCF)"
- Atlar, "What is the 13-week cash flow forecast?" and "The ultimate guide to the 13-week cash flow forecast"
- Stampli, "What is a 13-week cash flow forecast, and why..."
- Abacum, "13 Week Cash Flow Forecast Guide and Template"
- DebtBook, "How to Build a 13 Week Cash Flow Forecast"
- Wall Street Prep, "13-Week Cash Flow Model (TWCF) | Template Example"
- YouTube tutorial references supplied by reviewer