Inventory analysis starts with a practical question: which items are likely to run short, and which are tying up cash without moving? If your stock, sales, and purchase-order data live in separate Excel or CSV exports, you can still answer it. Bring the files to the same SKU and location level, calculate a few defensible measures, then investigate the exceptions before changing an order.
This guide walks through that process using fictional retail SKUs. The same logic can help with finished goods or spare parts, but manufacturing teams should add criticality, production demand, and substitution constraints before applying a retail-style reorder rule.
What inventory analysis should produce
An inventory report is useful when it leads to a decision, not merely a chart. A buyer needs a short list of items to expedite, orders to reconsider, and assumptions to verify. A finance lead may also want to know where stock is absorbing working capital. These are related questions, but they do not use exactly the same metric.
For a first pass, separate availability risk from excess-stock risk. A fast seller with four days of stock cover and a seven-day supplier lead time deserves attention. A product with almost a year of cover may need a promotion, transfer, or buying pause. Neither flag should be treated as an automatic purchase decision: open orders, seasonality, promotions, and data quality can change the answer.
If you need a broader view of sales, customers, and stock together, see hiData's retail analytics guide. This article stays at the SKU-level decision workflow.
Start with exports you can reconcile
Export an on-hand stock snapshot with an as-of date, SKU, location, and sellable units. Add sales or fulfilled-order lines for a defined period, plus open purchase orders with expected receipt dates and quantities. If you have them, bring backorders, returns, transfers, unit cost, and inventory values as separate fields. Keep the raw files unchanged so you can trace a surprising result to its source row.
Use a consistent key such as SKU plus location. A product sold in two stores should not inherit the combined sales rate while using one store's on-hand units. Normalize units of measure before joining: a case of 12 and a single unit are not interchangeable. Check duplicate SKUs, stale stock snapshots, negative quantities, cancelled orders, and receipts recorded after the snapshot date. If a channel was out of stock during the sales window, observed sales understate demand; flag that period rather than calling the item slow-moving.
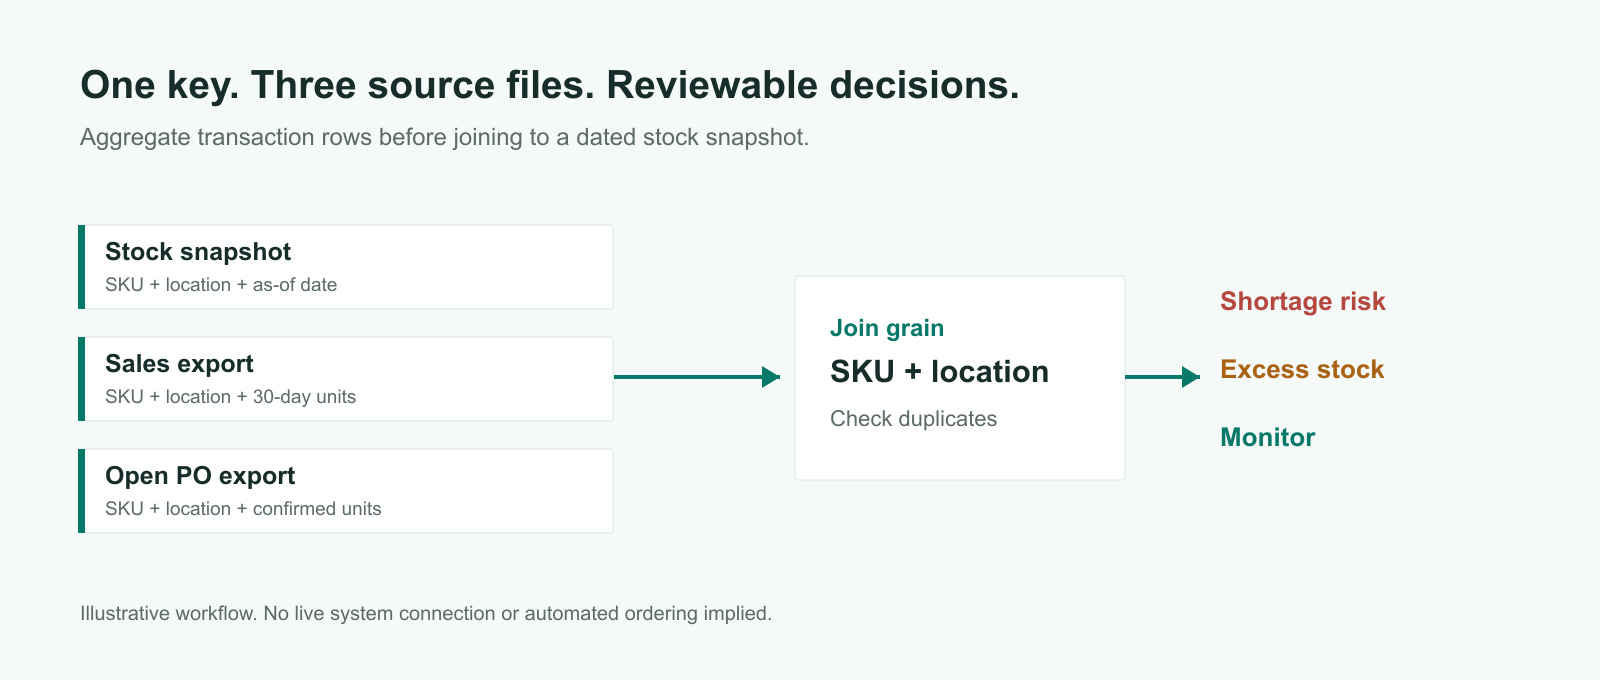
The file join is where many attractive dashboards quietly go wrong. A stock snapshot has one row per SKU-location-date, while sales have many transaction rows and purchase orders can have multiple open lines. Aggregate sales and open orders to the chosen SKU-location first. Then join those summaries to the snapshot. Otherwise, a many-to-many join can multiply stock and order quantities.
Calculate the measures that answer the decision
Choose one period and keep it visible. For the worked example below, the sales window is 30 calendar days, ending on the stock snapshot date. Use the same units and location in every numerator and denominator.
| Measure | Calculation | How to read it |
|---|---|---|
| Average daily unit sales | Units sold in period / days in period | A starting demand rate, not a forecast if demand was disrupted. |
| Days of stock cover | Sellable on-hand units / average daily unit sales | Roughly how long current stock lasts at that rate; undefined when sales are zero. |
| Reorder point | Average daily unit sales × lead time in days + safety stock units | A review trigger, not the order quantity. Compare it with inventory position. |
| Inventory position | On hand + confirmed on-order units - backorders | Do not count uncertain purchase orders as confirmed supply. |
| Inventory turnover | COGS for a period / average inventory at cost for that period | Uses cost values, not units or selling prices. |
In Excel, suppose one SKU summary row has on-hand units in B2 and 30-day units sold in C2. Daily sales in D2 can use =C2/30; cover in E2 can use =IF(D2>0,B2/D2,""). Adjust the references to your workbook. The blank is intentional. Zero recorded sales may mean a genuinely idle item, a stockout, or a missing sales feed, and an artificial infinity would hide that distinction. Use Microsoft's SUMIFS documentation when you need to aggregate sales by SKU, location, and date in a workbook.
Days of cover is not days inventory outstanding (DIO). Cover divides current units by a recent unit-sales rate. DIO divides average inventory value at cost by period COGS and multiplies by the number of days in that period. Inventory turnover and DIO need costed inventory at the beginning and end of the period, or a more representative average if balances swing. Do not infer turnover from one stock snapshot. NetSuite's inventory analysis guide covers the wider family of inventory KPIs; here we use only the measures needed for a first review.
A three-SKU inventory analysis example
Assume the following numbers come from one store's 30-day sales export and a same-day stock snapshot. The sample has no backorders or confirmed incoming purchase orders, so inventory position equals on-hand stock. Safety stock is a supplied planning assumption, not a number the analysis has discovered.
| SKU | On hand | Units sold / 30 days | Daily sales | Lead time | Safety stock | Days of cover | Reorder point | First review |
|---|---|---|---|---|---|---|---|---|
| LAMP-01 | 24 | 180 | 6.0 | 7 days | 10 | 4 days | 52 units | Expedite / confirm supply |
| MUG-02 | 120 | 10 | 0.33 | 14 days | 8 | 360 days | ~13 units | Review excess stock |
| TOWEL-03 | 60 | 45 | 1.5 | 14 days | 10 | 40 days | 31 units | Monitor |
For LAMP-01, 180 units over 30 days means six per day. Twenty-four sellable units provide four days of cover, shorter than the seven-day lead time. Its reorder point is 6 × 7 + 10 = 52 units. With no confirmed incoming order, the 24-unit inventory position is below that trigger. The immediate question is whether an existing unrecorded order, transfer, or short-term substitute can bridge the gap; placing a new standard order may arrive too late.
For MUG-02, ten sales over 30 days and 120 units on hand yield about 360 days of cover. The reorder point is about 10/30 × 14 + 8 = 12.7 units, rounded to 13 for a whole-unit planning view. That is a review flag, not a declaration that the stock is obsolete. Check promotions, seasonal demand, minimum order quantities, and whether the stock is sellable before freezing purchases or marking down the product.
For TOWEL-03, 45 sales over 30 days mean 1.5 per day; 60 units cover about 40 days. The reorder point is 1.5 × 14 + 10 = 31 units. With the assumptions shown, this SKU is neither an immediate shortage nor the clearest excess. Monitor it for a change in sales rate or lead time. All three judgments depend on the data and assumptions above; they are not customer results or live hiData outputs.
Add movement and business context
Days of cover catches obvious extremes, but it should not be your only ranking method. ABC analysis can focus review time on items that account for more annual consumption value. Calculate each SKU's annual units consumed multiplied by unit cost, sort by that value, then choose cutoffs that suit your assortment. The 30-day example does not provide annual demand or unit cost, so assigning A, B, and C labels to these three SKUs would be made-up precision.
A separate fast-, slow-, and non-moving view helps identify items with little recent activity. Define the time window, sales-channel coverage, and what counts as movement before using those labels. A low-volume critical spare part may be worth holding even when a retail mug with the same movement pattern is not. The distinction matters especially in manufacturing and healthcare, where availability can have consequences beyond lost retail sales.
For a management-level view across revenue, margin, and inventory, the retail KPI dashboard guide covers broader metrics. Keep this SKU review focused on the underlying rows and purchase decisions that a dashboard should surface.
Turn the export into a reviewable action list with AI
Excel remains useful for checking formulas and preserving a workbook that colleagues can audit. If the data arrive as several messy exports, hiData AI Sheets can help analyze uploaded spreadsheets, organize the results, and visualize patterns through questions in natural language. Start with files exported from your existing systems. This workflow does not assume a live ERP connection, an Excel add-in, automatic purchase orders, or that AI can verify supplier commitments on its own.
Ask for a narrow output first: “Using the uploaded stock snapshot, 30-day sales, and open-PO exports, join by SKU and location. Show rows with missing keys or unit mismatches before calculating anything.” After reviewing those exceptions, ask: “Calculate daily sales, days of cover, inventory position, and the supplied reorder point for each SKU-location. List the source fields used and leave cover blank where sales are zero.”
Only then request a summary: “Group the reviewed rows into potential shortage, potential excess, and monitor. For each flag, show the underlying quantities, the reason for the flag, and what a buyer should check next. Do not invent lead times, safety stock, or receipt dates.” A concise narrative can be useful, but the underlying rows and assumptions must remain visible. Check a sample manually before sharing a purchasing recommendation.
Common mistakes to catch before acting
The most serious error is mixing grains: company-wide sales divided by one location's stock can create a false shortage. A close second is counting an open PO as available stock even though its expected date is later than the stockout window. Separate on-hand cover from inventory position, and show the expected receipt date alongside any replenishment recommendation.
Watch for a recent promotion, holiday, launch, or prior stockout in the sales window. A 30-day average is a convenient starting point, not a demand model. Also distinguish returns from sellable receipts and exclude damaged or reserved stock if it cannot fulfill demand. For turnover, use COGS and average inventory at cost over the same period. Mixing sales revenue with inventory cost can make a weak item look deceptively productive.
Before circulating the analysis, confirm the snapshot date, SKU/location join, unit conversions, open-order status, lead times, safety-stock assumptions, and the biggest exception rows with the people who own those inputs. The point of the AI-assisted pass is to make that review faster and more complete, not to skip it.
A sensible weekly review rhythm
Refresh the exports on a consistent day, keep the prior snapshot, and compare how each flagged item changed. Has the lamp's confirmed receipt date moved? Did the mug sell through after a promotion? Did the towel's lead time increase? Record the decision, owner, and next check date next to the SKU. That simple habit turns a one-off spreadsheet into an inventory process that can be explained later.
Start with a handful of high-impact SKUs and validate the calculations before scaling to the whole assortment. When the inputs are trustworthy, AI Sheets can help turn the next set of exports into a focused list of stock risks and questions for the team. Final replenishment, transfer, and markdown decisions still belong to the people who know the demand and supplier context.
Frequently asked questions
What data do I need for inventory analysis in Excel?
At minimum, use a dated stock snapshot and dated sales lines with a common SKU and location key. Open purchase orders, backorders, lead times, and unit costs make the resulting review more useful. Without a consistent key and as-of date, even correct formulas can describe the wrong stock.
Is days of cover the same as inventory turnover?
No. Days of cover compares current units with a recent unit-sales rate. Turnover compares period COGS with average inventory value at cost over that same period. They answer related but different questions.
Can AI decide how much to reorder?
AI can organize uploaded data, calculate a supplied rule, and point to exceptions. An order quantity also depends on pack size, supplier minimums, service targets, cash constraints, confirmed receipts, and a reviewed demand assumption. Do not let a generated number bypass those checks.