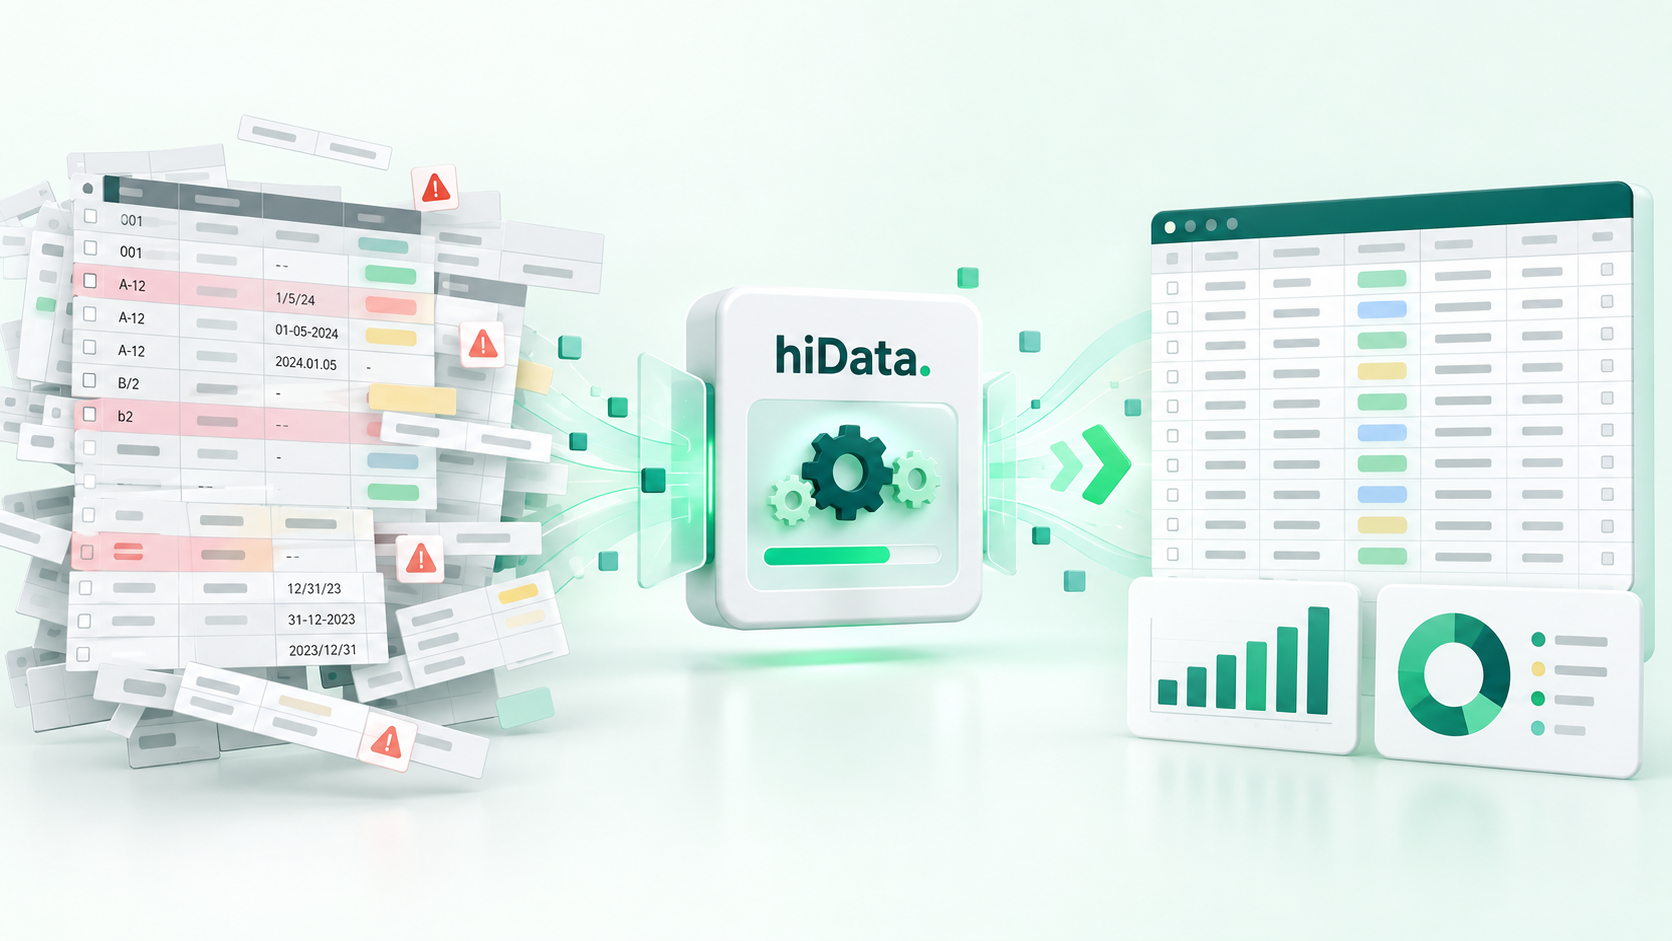
Every analyst wants to get to the insight. First, they usually have to fix the spreadsheet.
Data rarely arrives ready for analysis. Files exported from accounting systems, CRMs, online stores, surveys, or internal tools often contain duplicate rows, mixed date formats, missing values, numbers stored as text, and categories that almost match.
A spreadsheet may open normally and the formulas may run, but the result can still be wrong. That is why data cleaning is part of almost every analyst's work. It creates the reliable foundation needed for formulas, charts, dashboards, forecasts, and AI-assisted analysis.
What Is Data Cleaning?
Data cleaning is the process of finding and correcting inaccurate, incomplete, duplicated, inconsistent, irrelevant, or incorrectly formatted data.
It is also called data cleansing or data scrubbing. The goal is not simply to make a spreadsheet look tidy. The goal is to make each value clear enough that a person or tool can use it correctly.
A clean dataset is accurate enough for its purpose, consistent in structure, and clear about what is known, missing, or still under review.
Why Data Cleaning Matters
Dirty data usually fails quietly. Instead of displaying a warning, it produces a plausible-looking number that people may trust.
Duplicates inflate results
A repeated order can overstate revenue, units sold, and customer activity. The formula may be correct while the source records are not.
Inconsistent labels split one category
Values such as US, USA, U.S., and United States may appear as four regions. Standardizing them creates one reliable category.
Text numbers break totals
A revenue column may contain $1,200, 1,200 USD, and 1200. Some spreadsheet calculations may skip the text values or return an error.
Missing fields hide context
A blank product, date, or amount can make a KPI incomplete or impossible to explain. A blank also does not necessarily mean zero.
Clean data makes reporting more consistent, reduces time spent investigating disagreements, and gives AI tools a clearer table to interpret.
A Simple Data Cleaning Example
Consider this small sales export:
| Order ID | Date | Region | Revenue |
|---|---|---|---|
| 1001 | 09/01/26 | US | $500 |
| 1001 | 09/01/26 | US | $500 |
| 1002 | Sep 2, 2026 | USA | 750 USD |
| 1003 | 2026-09-03 | U.S. |
The file contains a possible duplicate, three date styles, three country labels, mixed revenue formats, and a missing value.
After review, the cleaned table could look like this:
| Order ID | Order Date | Region | Revenue | Review Status |
|---|---|---|---|---|
| 1001 | 2026-09-01 | United States | 500 | Duplicate reviewed |
| 1002 | 2026-09-02 | United States | 750 | Ready |
| 1003 | 2026-09-03 | United States | Missing revenue |
The important word is reviewed. Repeated values are not always duplicates. Two rows may share an invoice number because each row represents a different invoice line. A cleaning rule should follow the meaning of the data.
What Does a Clean Table Look Like?
A well-structured table gives analysis tools fewer opportunities to misunderstand the file.
A reliable table normally has:
- One clear header row
- A unique, descriptive name for every column
- One record per row
- One type of information per column
- Consistent date and number formats
- Stable identifiers such as Order ID or Invoice ID
- No merged cells or blank rows inside the data
- No subtotals or notes mixed with source records
- A defined treatment for missing values
Titles, notes, charts, and subtotals can still exist in the workbook. Keep them outside the source table so the underlying records remain predictable.
How the Data Cleaning Process Works
For most business spreadsheets, the process can be reduced to five stages.
1. Preserve the source
Keep an untouched copy of the original file or worksheet. This gives you a reference if a value is changed incorrectly or a record is removed by mistake.
2. Define the table
Confirm what one row represents, which fields are required, and which column or combination identifies a record.
For example, an invoice table may allow several rows with the same Invoice ID when each row represents a separate line item.
3. Standardize known formats
Apply clear rules to dates, numbers, currencies, category names, capitalization, and spacing.
Examples include:
- Converting all dates to
YYYY-MM-DD - Converting revenue values to numbers
- Removing leading and trailing spaces
- Mapping several country labels to one standard value
- Using one currency per column
4. Flag what needs judgment
Separate possible duplicates, missing fields, invalid relationships, and unusual values for review. Do not automatically delete every outlier or fill every blank.
5. Validate the result
Compare original and final row counts, key totals, duplicate counts, missing fields, and material category changes. The team should be able to explain why a number changed after cleaning.
Important: Do not turn uncertainty into a number. A blank value means the information is missing or unavailable. Zero is a known value. Treating them as the same can change totals, averages, and conclusions.
Data Cleaning vs. Data Transformation
Data cleaning fixes quality problems in existing data. Examples include correcting date formats, reviewing duplicates, and standardizing category labels.
Data transformation changes the structure or presentation of data for a specific purpose. Examples include grouping daily transactions by month, combining files, calculating revenue, or creating a customer-level summary.
The two processes often happen together. A team may clean product names and dates before transforming transaction records into a monthly sales report.
How AI Can Help Clean Spreadsheet Data
Traditional spreadsheet cleaning often requires formulas, filters, lookup tables, Power Query steps, or scripts. AI adds a more accessible interface: describe the intended result in plain English.
Example prompts include:
- “Find possible duplicate orders using Order ID. Do not delete them yet.”
- “Standardize dates as YYYY-MM-DD and flag values that cannot be converted.”
- “Convert the Revenue column to numbers.”
- “Group US, U.S., and USA under United States.”
- “Show rows where Product, Region, or Revenue is missing.”
- “Create a clean table with one header row and no blank rows.”
- “Compare totals before and after cleaning.”
Natural language reduces the need to remember a specific formula or menu path. It does not remove the need for judgment.
A safe AI-assisted workflow should:
- Preserve the original file.
- Explain the proposed rules.
- Flag ambiguous records instead of guessing.
- Keep a reviewable cleaned result.
- Compare important totals before and after cleaning.
With hiData AI Sheets, users can upload Excel or CSV files, ask cleaning questions in plain English, and turn prepared data into charts, summaries, and analysis-ready outputs.
Quick Data Cleaning Checklist
Before analyzing a spreadsheet, check that:
- Every column has a clear, unique heading.
- Each row represents one consistent record.
- Dates and numbers use valid data types.
- Categories follow one naming standard.
- Duplicate checks use the correct business key.
- Missing values remain different from zero.
- The original source is preserved.
- Key totals reconcile after cleaning.
Frequently Asked Questions
What is data cleaning in simple terms?
Data cleaning means finding and fixing problems in a dataset so it can be analyzed reliably. Common tasks include reviewing duplicates, standardizing formats, correcting data types, and identifying missing values.
Why is data cleaning important?
It prevents inconsistent labels, duplicate records, missing values, and incorrect formats from producing misleading totals, charts, reports, and AI answers.
What is the difference between data cleaning and data cleansing?
There is usually no practical difference. Both terms describe the process of improving the accuracy, consistency, and usability of data.
Can AI clean spreadsheet data?
AI can identify issues, standardize values, restructure tables, and apply instructions written in natural language. Important changes should still be reviewed and validated.
Should missing values be replaced with zero?
Not automatically. A blank means the value is unknown or unavailable. Zero is a real numerical value. Treating them as the same can change the analysis.
Clean the File Before You Trust the Chart
Reliable analysis begins before the first chart or formula is created.
By reviewing duplicates, standardizing formats, clarifying missing values, and organizing records into a consistent table, teams create a stronger foundation for reporting and decision-making.
Upload an Excel or CSV file, describe the cleaning task in plain English, and review a clearer table with hiData AI Sheets.