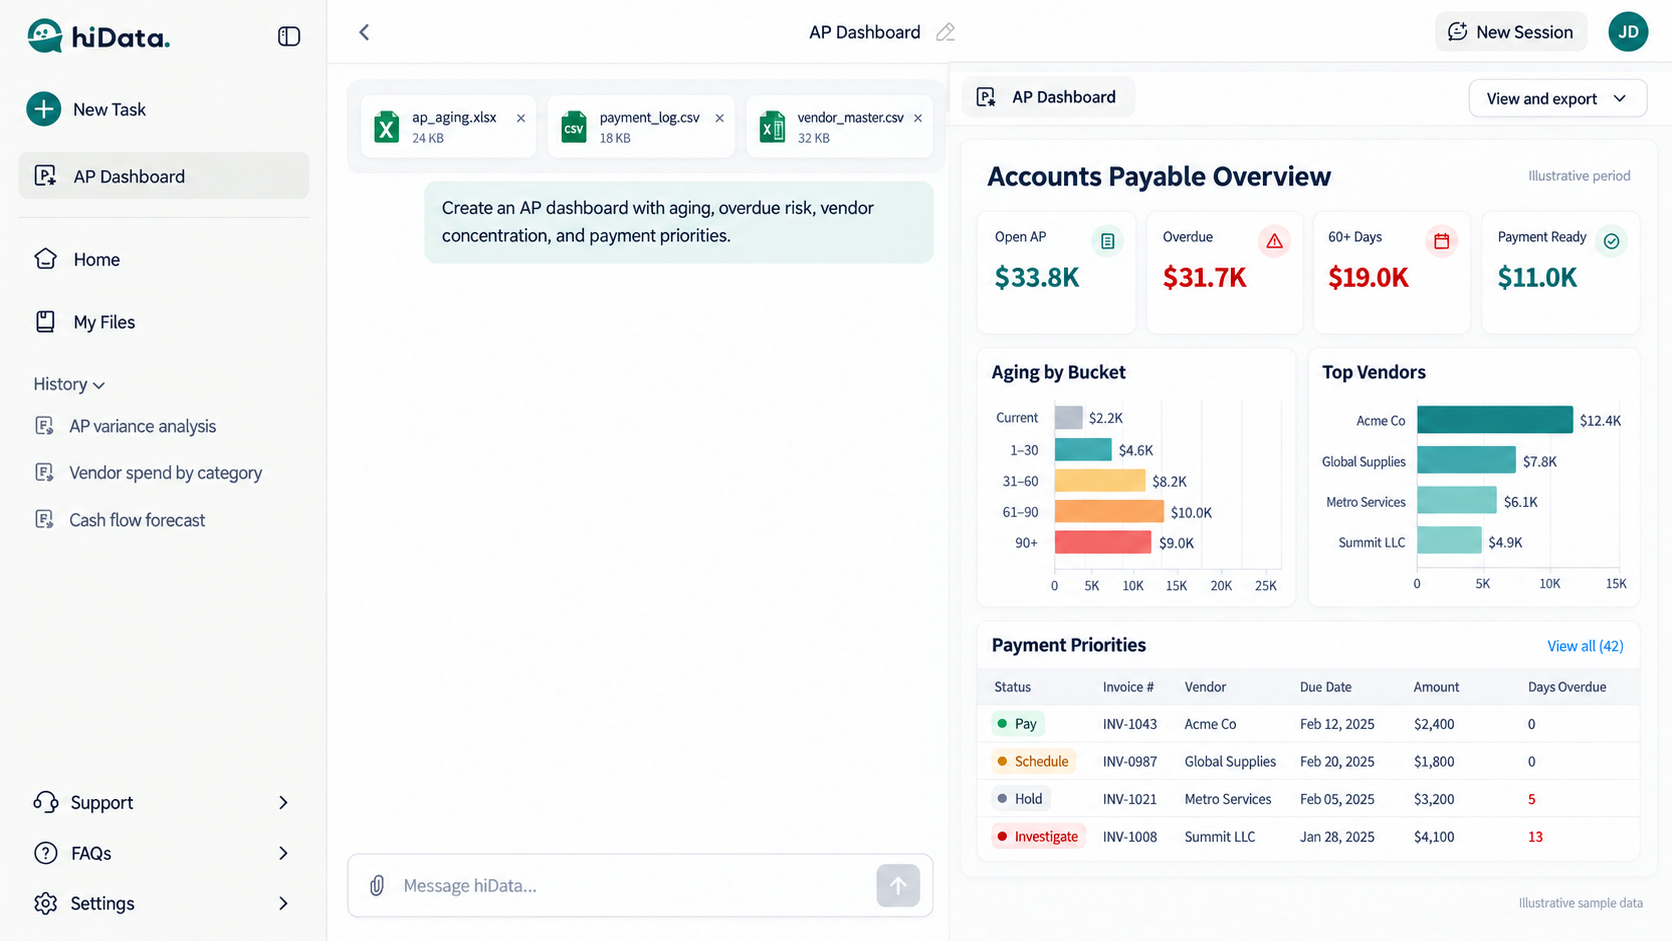
An accounts payable dashboard turns Excel or CSV exports into a reviewable view of what is owed, what is overdue, where supplier exposure is concentrated, and which invoices should be paid, scheduled, held, investigated, or corrected. With hiData AI Sheets, the spreadsheet is the source file: upload it, describe the analysis you need, and create the dashboard without manually assembling every formula, PivotTable, and chart.
If your immediate task is to understand standard aging buckets, start with the AP aging report guide. This article focuses on the next step: turning AP exports into a visual dashboard for weekly payment planning and management review.
Create an AP dashboard with AI Sheets
Illustrative product scenario based on the current hiData interface. The sample values are used to explain the workflow and do not represent customer data.
What an AP dashboard should answer
The dashboard should answer a short list of operational questions without forcing the reviewer to search through hundreds of invoice rows. How much AP is open? How much is already overdue? Which balances are more than 60 days past due? Which vendors account for the largest share? Which invoices are ready for the next payment run, and which require another decision first?
Those questions are related, but they are not interchangeable. Aging explains how long an invoice has been outstanding after its due date. Reconciliation establishes whether the total can be trusted. Payment priority adds business context such as holds, disputes, credits, critical suppliers, approvals, and available cash. The dashboard needs all three layers.
Start with Excel or CSV invoice data
Upload a file with one row per open invoice, credit memo, or unapplied item. Avoid starting from a pre-summarized vendor report because the summary may hide duplicate invoice numbers, missing due dates, partial payments, and credits that need separate treatment.
At minimum, keep vendor ID, vendor name, invoice number, invoice date, due date, original amount, applied payments, applied credits, status, owner, and notes. AI Sheets can use those fields to calculate open amount, days past due, aging bucket, and a preliminary payment-priority label, while preserving the invoice rows behind every summary.
The as-of date should live in one visible control cell. A fixed date makes a prior report reproducible. Using TODAY() throughout the workbook can silently move invoices between buckets when someone reopens the file later, which makes review and audit work harder.
How to create an AP dashboard from Excel data with AI
1. Export the AP files you already use
Export the open invoice or vendor ledger detail from the accounting system. Include credit memos and partially paid invoices, not only positive unpaid bills. If the export contains multiple currencies, retain both transaction currency and reporting currency rather than combining values that have not been converted on a consistent basis.
Save the untouched export separately, then upload the working copy to AI Sheets. If invoice details, payment logs, approval statuses, or vendor mappings live in separate files, upload the relevant Excel or CSV exports together so the analysis can use the fields you actually provide.
2. Ask AI Sheets to clean and combine the records
Ask AI Sheets to standardize vendor names, date formats, amount fields, invoice identifiers, and status labels before creating metrics. The same supplier may appear under several spellings, and a due-date column stored as text will not behave correctly in aging calculations.
Check for blank invoice numbers, blank due dates, duplicate vendor-and-invoice combinations, and negative open amounts. A negative amount may be a valid credit, but it should not be mixed into a payment-ready total without review.

3. Define the calculations in plain language
Tell AI Sheets exactly how the measures should work. Open amount is the original invoice amount less applied payments and applied credits. Days past due is the later of zero or the number of days between the as-of date and due date. An invoice due in the future should therefore show zero days past due and remain in the Current bucket.
Keep the as-of date, currency basis, and missing-data rules in the prompt. Ask the system to leave missing due dates visible rather than forcing those rows into a valid bucket. The downloadable workbook remains available as a transparent sample dataset and formula reference, but it is not the main product workflow.
4. Generate aging and exception fields
Ask AI Sheets to create Current, 1-30, 31-60, 61-90, and 90+ day buckets using the due date. The boundaries must be documented and applied consistently. An invoice exactly 30 days past due belongs in 1-30; an invoice at 31 days moves into 31-60.
Use due-date aging when the business question is whether payment is late. Invoice-date aging can be useful for process backlog analysis, but it answers a different question and should be labeled separately.
5. Create the dashboard and the KPIs that support a decision
Ask for a dashboard with KPI cards, an aging chart, a vendor-concentration view, and a payment-priority table. Do not fill it with every metric available in the export. Use a compact set that explains exposure and action. The following measures work well for a weekly AP review.
| KPI | Calculation | What it helps answer |
|---|---|---|
| Total open AP | Sum of open amounts, including reviewed credits | What is the net amount currently open? |
| Overdue AP | Positive open amounts with days past due greater than zero | How much requires immediate attention? |
| Overdue ratio | Overdue AP divided by total open AP | How much of the balance is already late? |
| 60+ exposure | Positive open amounts more than 60 days past due | Where is aging risk becoming material? |
| Largest vendor share | Largest vendor open balance divided by total open AP | Is exposure concentrated with one supplier? |
| Payment-ready AP | Approved items labeled Pay now or Schedule | What can enter the proposed payment run? |
Days Payable Outstanding can be useful, but it requires a consistent purchases or cost-of-sales denominator and a defined period. Do not calculate DPO from the open invoice file alone. If the necessary denominator is unavailable, leave the metric out instead of substituting an unrelated value.
6. Review vendor concentration and drill back to source rows
The dashboard should group open amounts by vendor and sort from largest to smallest. The resulting view shows whether a small number of suppliers dominate the payable balance. A large share is not automatically a problem. It becomes useful when combined with supplier criticality, payment terms, disputes, and the effect of delaying payment.
Review concentration at the vendor-group level when several legal entities belong to the same commercial supplier. Otherwise, the dashboard may understate exposure by splitting one relationship across several names.
7. Generate and review the payment-priority queue
Age alone should not decide payment. A 90-day invoice under a documented dispute should not be paid simply because it is old, while a current invoice for a critical supplier may need to be scheduled before its due date.
Ask AI Sheets to create a review queue with five actions. Pay now means the invoice is approved, valid, due, and fundable. Schedule means it is valid but not yet due or belongs in a later payment run. Hold means an approval, contract, receiving, tax, or documentation condition remains open. Investigate covers disputes, very old balances, suspected duplicates, or unclear credits. Correct is used for unapplied credits, data errors, or items that should not remain as ordinary open invoices.
Treat those labels as review aids, not payment authorization. The final payment file still needs the organization's normal approval, bank-detail verification, segregation of duties, and cash controls.
Example dashboard output from sample Excel data
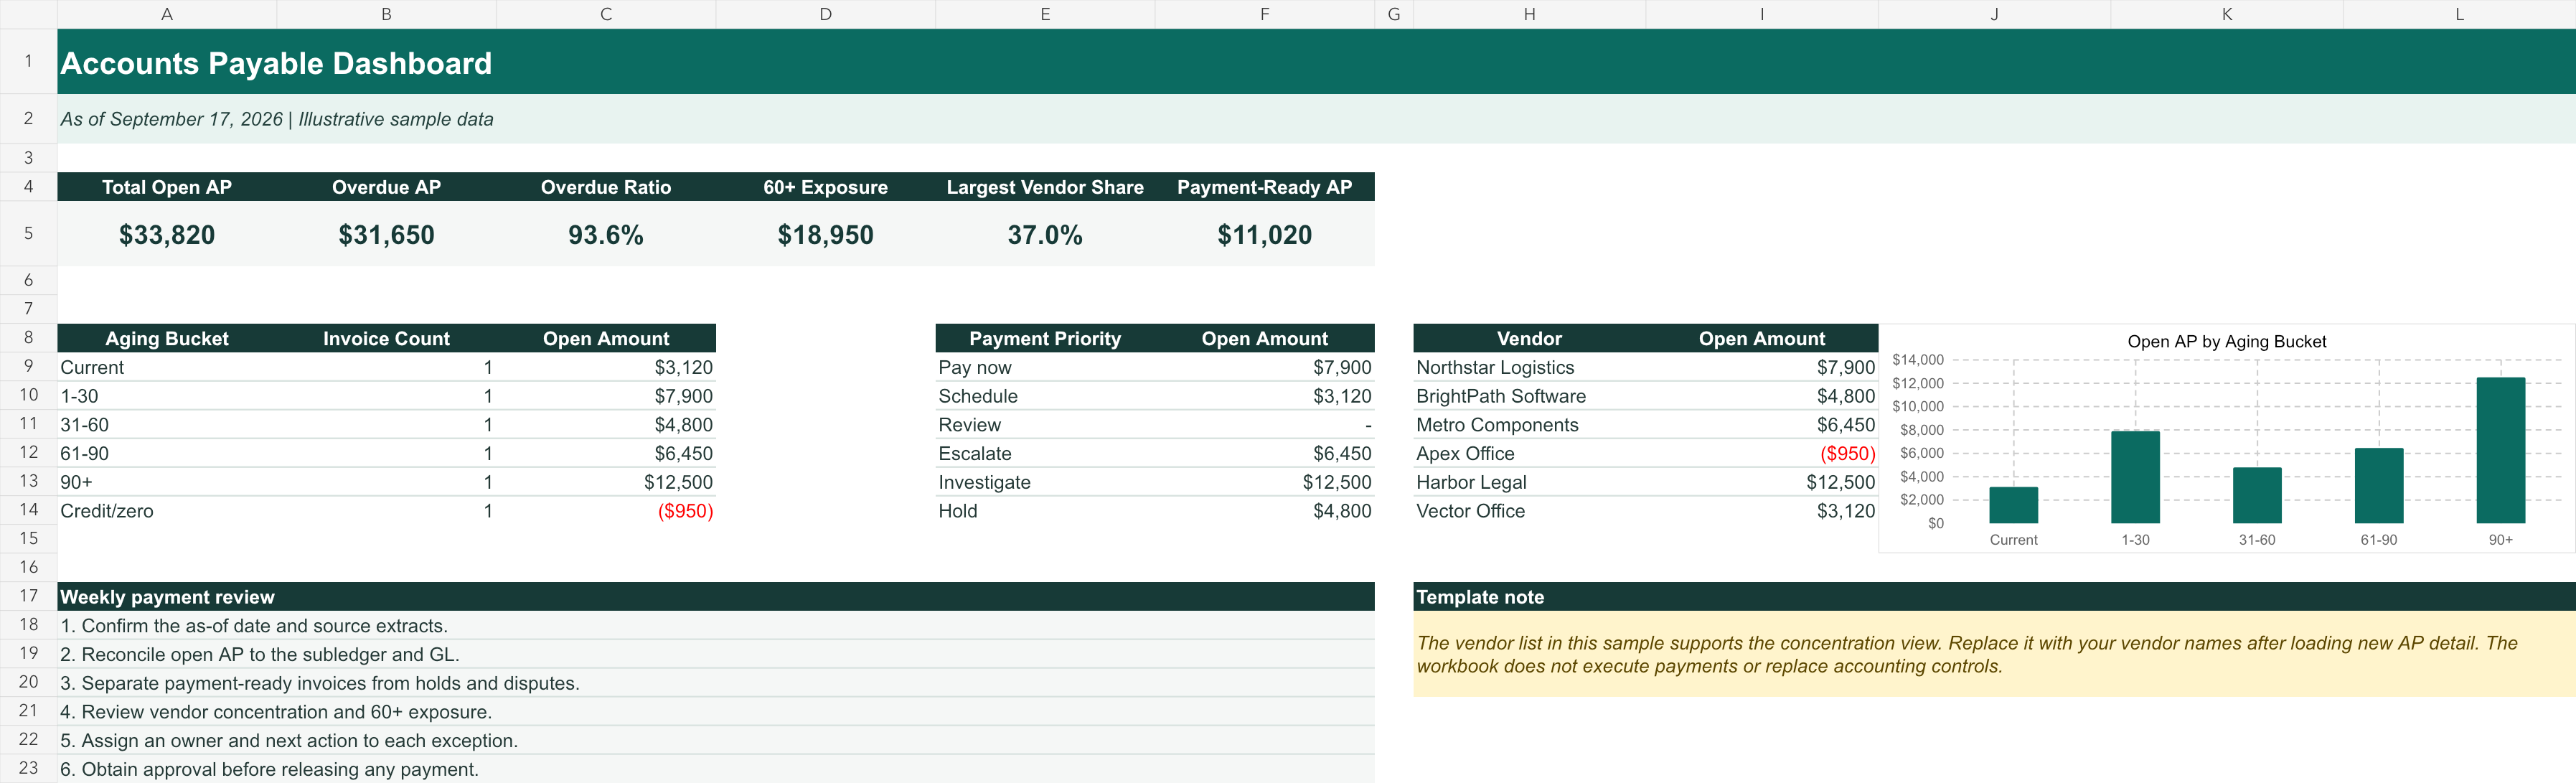
The sample file contains illustrative data so the analysis and review flow can be tested without exposing a company's records. Whether the file is analyzed in AI Sheets or opened in the downloadable workbook, the same six rows should produce $33,820 of net open AP, $31,650 of overdue positive balances, $18,950 more than 60 days overdue, and $11,020 labeled payment-ready. Harbor Legal is the largest sample vendor at 37.0% of net open AP, but its $12,500 balance is disputed and therefore remains outside the payment-ready total.
| Vendor | Open amount | Aging bucket | Status | Payment priority | Why |
|---|---|---|---|---|---|
| Northstar Logistics | $7,900 | 1-30 | Open | Pay now | Approved carrier invoice |
| BrightPath Software | $4,800 | 31-60 | Hold | Hold | Renewal scope needs confirmation |
| Metro Components | $6,450 | 61-90 | Open | Escalate | Material production supplier balance |
| Apex Office | ($950) | Credit/zero | Review | Correct | Unapplied credit memo |
| Harbor Legal | $12,500 | 90+ | Disputed | Investigate | Documented fee dispute |
| Vector Office | $3,120 | Current | Open | Schedule | Valid invoice due in a future run |
This example also shows why a dashboard should not equate overdue AP with cash required today. Paying every overdue line would include a disputed legal invoice and an unresolved software hold. The payment-ready amount is lower because the queue separates age from approval and exception status.
The screenshot below is the downloadable Excel reference built from the same sample rows. It is included so readers can inspect the calculations and expected totals; the primary hiData workflow is to upload the source data and create the dashboard in AI Sheets.
Reconcile the dashboard before using it
Before the dashboard is used for decisions, reconcile its total open AP to the AP subledger and the general ledger control account for the same entity, currency basis, and cutoff date. A difference may come from postings after the extract, excluded vendors, unposted invoices, journal entries, foreign-exchange treatment, or filters applied to only one source.
The accounts payable reconciliation guide covers that control in more detail. The key rule for this workbook is simple: a clean-looking dashboard is not evidence that the underlying population is complete.
Document the reconciliation result near the report date. If the dashboard does not tie, state the difference and owner instead of marking the report complete. Management should be able to distinguish a genuine payment recommendation from a number still under investigation.
Use the dashboard in a weekly AP review
Start the meeting by confirming the as-of date, entities, currencies, and source extracts. Then review total open AP, overdue AP, and 60+ exposure. Large changes should be explained by invoice-level records rather than by a chart alone.
Next, work through the payment-priority queue. Confirm that Pay now and Schedule items are valid and approved. For Hold, Investigate, and Correct items, assign an owner and next date. The dashboard becomes useful when every material exception leaves the meeting with a clear action.
Finish by comparing the proposed payment-ready amount with the approved cash plan. The dashboard can organize the candidate invoices, but it does not decide how much cash the business can release.
Connect the dashboard to invoice processing
The quality of the dashboard depends on upstream invoice work. Missing purchase orders, unresolved receiving differences, duplicate invoices, and approval delays usually appear later as holds or old balances. The invoice processing guide explains how those items move from intake through matching, exception review, approval, and payment readiness.
Use the dashboard to identify where the backlog is accumulating, then return to the source process to fix recurring causes. If one vendor repeatedly appears in the Hold queue, the useful question is not only how much is overdue. It is why the same exception keeps preventing approval.
Refine the dashboard in AI Sheets
When AP detail is spread across several Excel or CSV exports, hiData AI Sheets can clean headers, standardize categories, combine tables, calculate fields, and generate a dashboard from the uploaded files. A finance user can ask for aging by due date, overdue exposure by vendor, missing-field checks, charts, KPI cards, and a draft payment-priority table in plain language.
Keep the workflow grounded in the supplied files. This article does not claim a direct ERP connection, live accounting sync, approval routing, or payment execution. Review the generated classifications and totals against the source rows before using them in a payment decision.
Useful prompts include:
- Calculate open amount as original amount less applied payments and credits. Flag rows with missing due dates.
- Group positive open balances into Current, 1-30, 31-60, 61-90, and 90+ buckets using September 17, 2026 as the as-of date.
- Summarize open AP by vendor and show each vendor's share of the total. Keep credits visible.
- Create a review table for Pay now, Schedule, Hold, Investigate, and Correct. Include the source invoice number and reason.
- Compare the dashboard total with the AP control total I provide and list any difference without forcing a match.
Common mistakes to avoid
Using invoice date instead of due date without saying so. This makes an operational backlog look like overdue payment exposure. Label the date basis and keep it consistent.
Netting credits too early. A credit can reduce the headline total while still requiring application to a specific vendor or invoice. Keep credits visible until they are resolved.
Treating every overdue invoice as payment-ready. Aging is one input. Holds, disputes, approvals, supplier importance, and the cash plan still matter.
Calculating DPO from incomplete data. An open AP export does not contain the denominator required for a reliable DPO calculation. Add the metric only when purchases or cost of sales and the period definition are available.
Building charts before reconciliation. Charts can make incomplete data look authoritative. Tie the population first, then summarize it.
Hiding source rows. Reviewers need a path from every KPI and priority label back to the invoice detail. Preserve the source identifiers and keep formulas inspectable.
Download the sample Excel data and reference dashboard
The workbook includes a Dashboard sheet and an AP Detail sheet. Use it as sample input, a formula reference, or a fallback review file. For the product-led workflow, upload your own AP export or the sample detail to AI Sheets and ask it to create the dashboard you need.
Download the free accounts payable dashboard Excel template
The template is a spreadsheet review aid. It does not replace the accounting system, reconciliation controls, invoice approval, bank-detail verification, or authorized payment execution.
Frequently asked questions
What should an accounts payable dashboard include?
At minimum, include total open AP, overdue AP, aging buckets, 60+ exposure, vendor concentration, payment-ready AP, and an invoice-level exception queue. Each summary should trace back to the underlying records.
How often should an AP dashboard be updated?
Many teams review it weekly and refresh it before each payment run. Month-end versions should use a fixed cutoff date and reconcile to the AP subledger and GL control account.
What is the difference between an AP dashboard and an AP aging report?
An AP aging report organizes open balances by how long they have been past due. An AP dashboard adds KPIs, vendor concentration, exception status, payment priorities, and actions for the review team.
Can hiData create an AP dashboard from an Excel file?
Yes. Upload the Excel or CSV export to AI Sheets, define the as-of date and calculation rules, and ask for aging, KPI cards, vendor concentration, charts, and a payment-priority table. The output remains a review aid, so finance users should confirm the source rows, approvals, disputes, available cash, and payment authorization.
Should credits be included in total open AP?
Credits should remain visible and may be included in a net open AP total if the basis is clearly labeled. Also show them separately so unapplied or incorrect credits are not hidden by netting.
Can AI Sheets build the dashboard from accounting exports?
AI Sheets can analyze uploaded Excel or CSV files, standardize fields, calculate summaries, and create dashboards and charts from the provided data. Users should verify classifications and totals against the source files. This workflow does not imply direct accounting-system integration or payment execution.
Sources and methodology
- Microsoft Learn: Aged Accounts Payables Excel report describes due-date aging in Excel, vendor ledger data, filtering, and prioritizing overdue payments.
- Microsoft Support: Create a PivotTable to analyze worksheet data explains the Excel feature used to summarize detailed records by vendor, status, or aging bucket.
The numerical example in this article is illustrative sample data created for the downloadable workbook. It is not a customer case study, benchmark, or representation of hiData product usage.
Build your AP review with hiData
Upload your AP aging export, invoice list, payment log, or vendor file to AI Sheets. Organize the records, review overdue exposure, and prepare a payment-priority summary while keeping the source rows available for finance review.