A vendor spend analysis organizes supplier-level purchasing data so finance and procurement teams can see who receives the money, what the business buys, where spend is concentrated, and which transactions need review. The useful output is not simply a ranked vendor list. It is a traceable view of supplier aliases, categories, departments, contract status, trends, and source transactions.
This guide shows how to build that view from exported Excel or CSV files. The workflow is designed for teams that already have accounts payable, purchase order, invoice, contract, or vendor-master exports but do not yet have one reliable supplier-spend dataset. AI can accelerate cleaning, classification, summarization, and exception review, while finance and procurement retain responsibility for mappings, contracts, negotiations, and final decisions.
Download the free vendor spend analysis Excel template to inspect the formulas and illustrative transaction data used in the worked example.
Key takeaways
- Vendor spend analysis is narrower than general spend analysis: it focuses on supplier-level spend, concentration, overlap, contract coverage, and change over time.
- Clean vendor identity is the first control. A supplier shown under several names can distort concentration, tail-spend, and negotiation analysis.
- Track data coverage before interpreting business KPIs. Uncategorized spend or missing contract status can make a polished dashboard unreliable.
- A concentration or duplicate-vendor flag is a prompt for investigation, not an instruction to consolidate suppliers automatically.
- AI can help analyze uploaded spreadsheets and expose source rows, but it should not invent contract status, expected savings, or supplier-performance conclusions.
What is vendor spend analysis?
Vendor spend analysis is the process of collecting, cleaning, classifying, and reviewing transactions by supplier. It answers practical questions: Which vendors receive the most spend? Which categories use overlapping suppliers? How much spend is off contract? Which supplier costs changed materially? Where should procurement or finance investigate first?
It is a supplier-focused subset of broader spend analysis. Amazon Business similarly separates vendor-level analysis from the wider view of organizational spending, while Ramp distinguishes spend visibility from supplier-performance management. The distinction matters because spend data shows financial exposure and purchasing patterns; it does not, by itself, prove whether a supplier delivered on time, met quality requirements, or represents a continuity risk.
Use a separate supplier scorecard when the decision depends on delivery, quality, approved pricing, or service evidence. Link the two datasets only after defining compatible supplier IDs, periods, and counting rules.
Data needed for a reliable analysis
Start with transaction-level detail rather than a pre-aggregated vendor report. One row should represent a documented unit such as an invoice line, purchase-order line, or card transaction. Do not mix these grains in one table without first deciding how duplicates and joins will be controlled.
| Field | Why it matters | Minimum control |
|---|---|---|
| Vendor ID and vendor name | Identifies the legal or operating supplier | Preserve the source ID and map display-name aliases separately |
| Invoice or PO number | Supports duplicate checks and source tracing | Combine with vendor and entity where document numbers may repeat |
| Transaction date | Supports period and trend analysis | State whether the analysis uses invoice, posting, payment, or order date |
| Description or item | Helps category classification | Retain the original description even after adding a normalized category |
| Category | Enables category and overlap analysis | Maintain an Unmapped value instead of guessing |
| Department, entity, or cost center | Shows who drives the spend | Use one approved organizational mapping |
| Net amount and currency | Provides the spend measure | Separate tax, credits, and base-currency conversion where relevant |
| Contract or preferred-vendor status | Supports compliance analysis | Use Unknown when contract evidence is unavailable |
| Payment terms | Supports cash and terms review | Confirm that the field reflects the approved agreement |
Purchase-order exports add quantities, approved prices, requesters, receipts, and open commitments. AP exports add invoices, credits, payments, and posting information. Contract data adds status, expiry, pricing terms, and ownership. If these files use different periods or supplier keys, reconcile them before drawing conclusions. The purchase order management guide explains the PO lifecycle, while accounts payable reconciliation covers the control needed before AP totals are treated as final.
How to conduct vendor spend analysis in Excel
1. Define the scope and collect exports
Write down the reporting period, entities, currencies, transaction grain, included spend, and intended decision. A review of posted supplier invoices is different from a review of purchase commitments or cash payments. Mixing all three can double count the same obligation.
Keep each original export unchanged and add a source-file field when combining records. Common inputs include AP detail, PO lines, card transactions, expense data, vendor master records, and a contract or preferred-supplier list. GEP's vendor-spend process also begins with collection and cleaning before classification or opportunity analysis.
2. Clean and normalize vendor data
Standardize spacing, punctuation, capitalization, and known aliases, but do not merge records only because names look similar. Northstar Industrial Ltd. and North Star Industrial may be the same supplier; two businesses that share the word Atlas may not be.
Build a visible mapping table with source name, normalized vendor, stable vendor ID, mapping basis, reviewer, and status. Retain unresolved names as Review required. This lets a reviewer see which consolidation was approved and prevents an AI suggestion from silently changing the population.
3. Classify spend and measure coverage
Map each transaction to a category, department or entity, direct or indirect spend, and contract status where those fields are available. Use a controlled taxonomy that is detailed enough to support decisions but stable enough to repeat next month.
Before interpreting spend, calculate three coverage measures:
- Vendor match rate: spend assigned to an approved normalized vendor divided by total spend.
- Category coverage: categorized spend divided by total spend.
- Contract-status coverage: spend marked contracted, non-contracted, or verified preferred status divided by total spend.
An Unknown value is more honest than a fabricated classification. If 30% of spend lacks contract status, an off-contract KPI describes only the covered population unless the denominator is clearly adjusted.
4. Build vendor-level summaries
Create a summary with one row per normalized vendor. Include total spend, share of total, invoice count, average invoice, category count, department count, first and last transaction date, contract status, and period change where prior data is available.
Then create views by vendor and category, vendor and department, and vendor and month. This is a practical version of a spend cube: supplier, category, and organizational owner provide three useful dimensions without requiring a complex model. Aggregate first, then join summaries; joining two line-level files carelessly can multiply transactions.
5. Calculate KPIs and investigate exceptions
Use KPIs to prioritize source-row review, not to manufacture a savings claim. Useful measures include:
| KPI | Calculation | Interpretation control |
|---|---|---|
| Vendor share | Vendor spend / total spend | Confirm aliases and intercompany exclusions first |
| Top 5 concentration | Spend with five largest vendors / total spend | High concentration can create leverage or dependency; context decides |
| Active vendor count | Distinct normalized vendors with in-scope spend | Define whether credits-only or inactive records count |
| Tail-spend percentage | Spend with vendors below the approved threshold / total spend | State the threshold; there is no universal cutoff |
| Off-contract spend | Verified non-contract spend / spend with known contract status | Do not classify missing contract data as off contract |
| Average invoice value | Vendor spend / valid invoice count | Credits and line-level exports require adjustment |
| Period variance | Current-period spend - comparison-period spend | Separate price, volume, timing, scope, and coding effects |
Open the underlying transactions for every material flag. A large increase may be a contract renewal, a timing shift, an acquired entity, duplicate invoices, or a genuine change in demand. The metric points to the question; the source records and business owner establish the answer.
6. Validate findings and prioritize actions
Translate each finding into a review item with evidence, owner, next action, and status. Keep opportunity stages separate:
- Potential opportunity: an analytical pattern worth investigating.
- Validated opportunity: procurement and the business confirm that the scope, supplier alternatives, contract terms, and operational requirements support action.
- Savings realized: the change has been implemented and the financial result is visible under an agreed measurement method.
This separation prevents a concentration chart from becoming an unsupported savings forecast. Supplier consolidation can reduce fragmented buying, but it can also increase dependency, transition effort, or service risk. Finance, procurement, operations, legal, and the relevant category owner should validate the decision.
Vendor spend analysis example
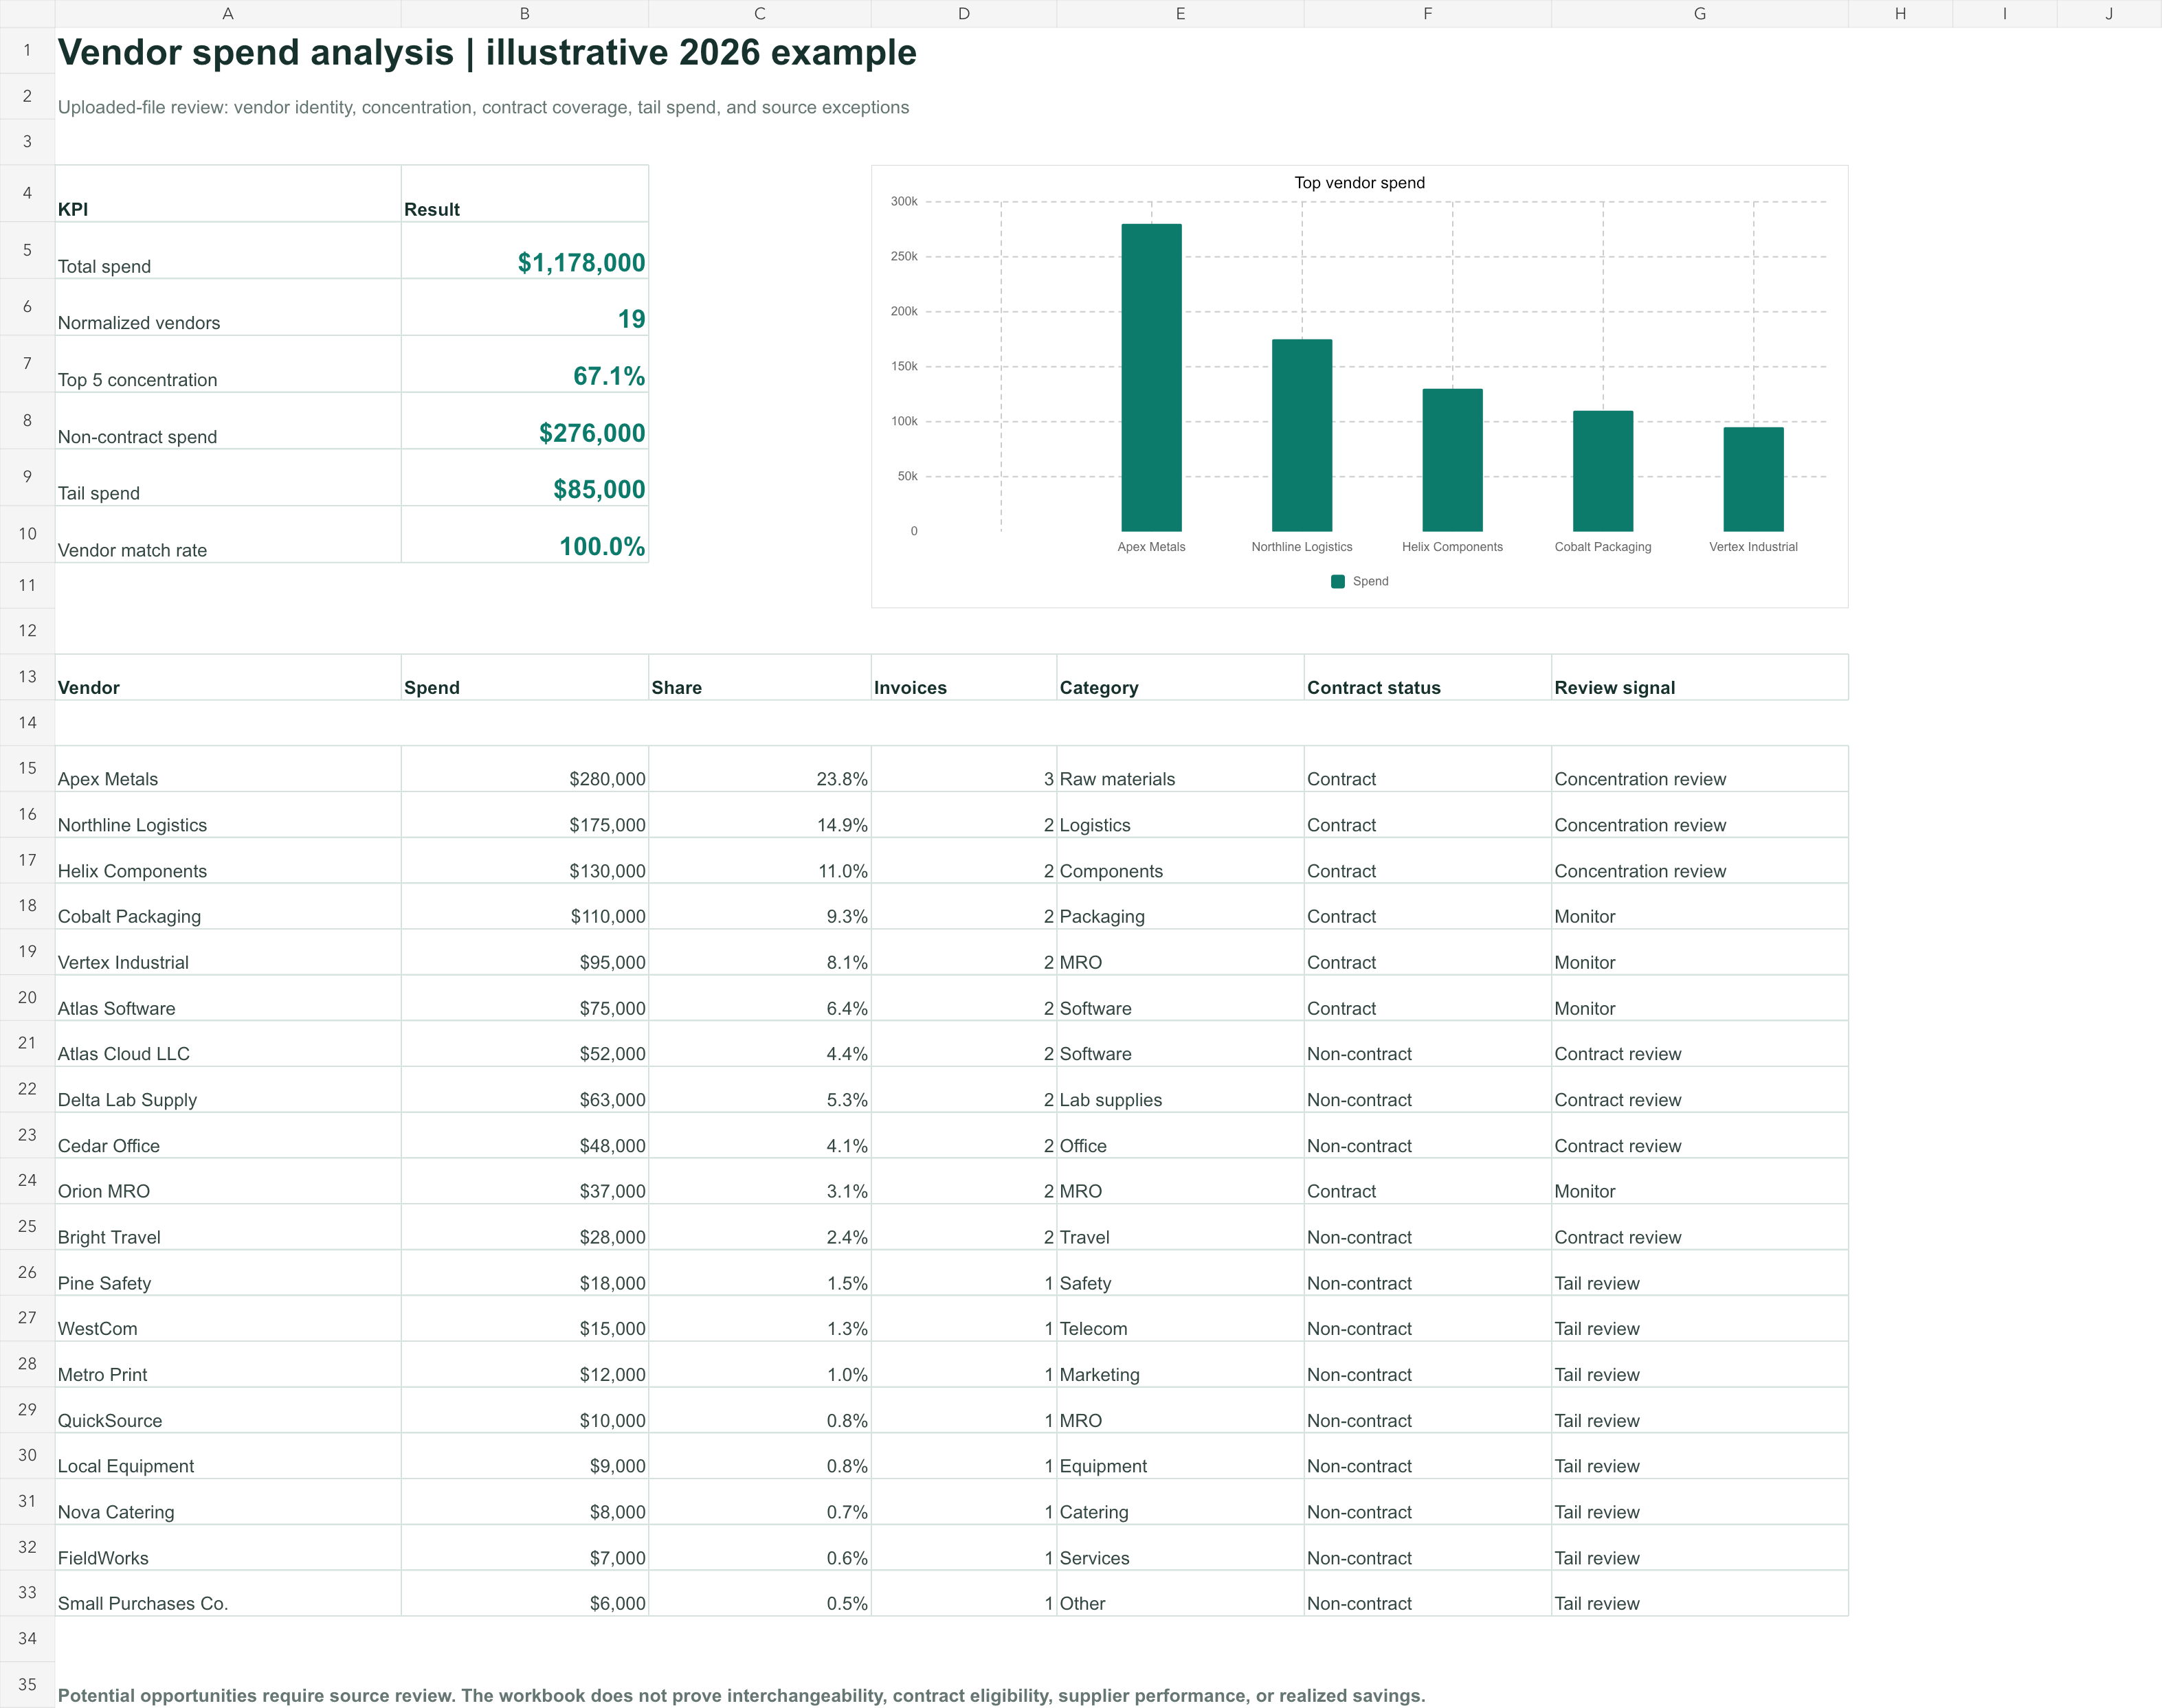
The downloadable workbook contains illustrative annual spend of $1.178 million. The raw export contains 20 supplier labels; an approved alias mapping reduces them to 19 normalized vendors. That identity correction changes the rankings before any commercial conclusion is made.
The five largest suppliers account for $790,000, or 67.1% of total spend. This concentration deserves review, but it is not automatically good or bad. Procurement may have strong leverage with strategic suppliers, or the business may have a dependency that requires alternatives and continuity planning.
Transactions marked non-contract total $276,000, or 23.4% of the sample. Vendors below the illustrative $25,000 tail threshold account for $85,000, or 7.2%. Both percentages are review signals. The contract field and threshold are assumptions supplied with the example, not universal standards.
The software category includes $75,000 with Atlas Software under contract and $52,000 with Atlas Cloud outside a recorded contract. The analysis flags overlap and requests source review. It does not assert that the services are interchangeable or that $52,000 can be eliminated. The responsible owner must compare functionality, users, renewal dates, switching costs, data requirements, and contract terms.
What a vendor spend analysis dashboard should show
A useful dashboard should lead from overview to evidence. It should not require the reader to infer what action a decorative chart supports.
- A KPI row shows total spend, normalized vendor count, Top 5 concentration, non-contract spend, tail spend, and data coverage.
- A Pareto view shows how quickly cumulative spend concentrates across vendors.
- A monthly trend highlights material changes and whether they are isolated or persistent.
- A vendor-by-category view exposes supplier overlap and categories dominated by one supplier.
- A contract-status view separates verified contract, verified non-contract, and unknown populations.
- An exception table lists the supplier, reason, amount, source document, owner, and next step.
Every summary should trace to the included source rows. If the dashboard says software spend increased, the reviewer should be able to see which invoices, departments, or suppliers produced the change.
How AI helps analyze exported vendor spend
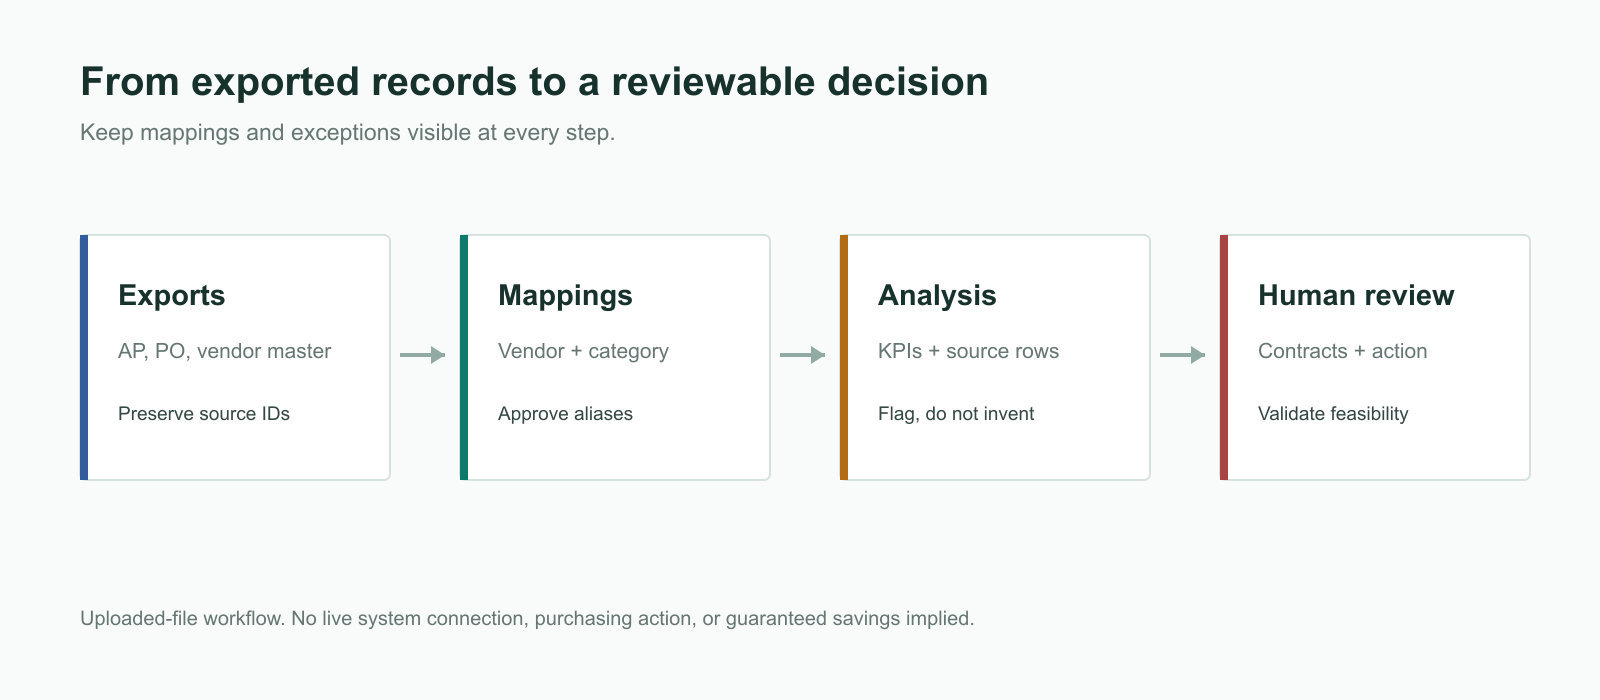
With hiData AI Sheets, teams can upload supported Excel or CSV files and ask for cleaning, classification, analysis, charts, and summaries based on the supplied data. A controlled workflow starts with completeness and identity checks:
Review the uploaded vendor-spend file. List missing vendor IDs, duplicate document keys, blank amounts, unrecognized currencies, and vendor names that may be aliases. Do not merge or classify them automatically.
After the mapping is approved, request a supplier summary:
Use the approved vendor mapping and category mapping. Summarize spend by normalized vendor, category, department, contract status, and month. Calculate each vendor's share of total spend and list the source rows behind every result.
Then ask for exceptions rather than invented explanations:
Flag Top 5 concentration, vendors below the supplied tail-spend threshold, verified non-contract spend, category overlap, and material period changes. Separate confirmed facts from questions requiring procurement or finance follow-up.
This is an uploaded-file analysis workflow. It does not claim that hiData connects directly to an ERP or AP system, reads current contracts automatically, approves suppliers, negotiates terms, executes purchases, monitors suppliers continuously, or realizes savings without human action.
Common data problems and controls
Vendor aliases and legal entities. Preserve source IDs and document the mapping basis. Similar names are not sufficient evidence of identity.
Mixed transaction grain. Invoice headers, invoice lines, PO lines, receipts, and payments answer different questions. Define one primary grain and aggregate other sources before joining.
Credits and reversals. Keep signed amounts and document types. Removing negative records can overstate spend and hide corrected duplicates.
Multiple currencies. Retain transaction currency, original amount, conversion rate, base-currency amount, and conversion date. Do not add currencies without conversion.
Gross versus net spend. Decide whether tax, freight, rebates, and credits are included. Use the same basis across vendors and periods.
Missing contract evidence. Separate Non-contract from Unknown. Treating every unknown record as non-compliant inflates the exception population.
Category drift. Keep a versioned mapping table and an unmapped queue. If categories change between periods, restate the comparison or explain the scope change.
Intercompany and employee transactions. Exclude or label them under an approved rule so they do not appear as external supplier opportunities.
Turning analysis into procurement decisions
Prioritize findings by financial exposure, evidence quality, timing, feasibility, and operational risk. High-spend contract renewals may deserve immediate review. A fragmented low-value category may be suitable for catalog or preferred-vendor controls. A sudden vendor increase may require a budget owner to explain scope or timing before procurement acts.
Connect related workflows instead of forcing one dashboard to do everything. Use purchase order management for open commitments, approvals, receipt status, and PO closure. Use an accounts payable dashboard for aging and payment priorities. Use the supplier scorecard template when delivery, quality, and approved-price performance matter.
For every action, record the supplier, category, evidence, responsible owner, decision date, and outcome. A quarterly refresh can then show whether the original exception was corrected, accepted, deferred, or invalidated by better information.
Choosing a vendor spend analysis tool
Excel works well for a periodic analysis with a controlled population, visible formulas, and hands-on source review. BI platforms are useful when a governed data model already exists and users need recurring visual exploration. Procurement suites support workflows such as approvals, contracts, catalogs, and purchasing controls. AI-assisted spreadsheets can reduce preparation time when the immediate problem is cleaning and analyzing existing exports.
Choose the tool according to the operating requirement. Do not purchase an integration-heavy platform when a quarterly file review is sufficient, and do not present a manual workbook as continuous spend control when the organization needs live approvals and contract enforcement.
Frequently asked questions
What is vendor spend analysis?
Vendor spend analysis is the collection, normalization, classification, and review of supplier-level transactions to understand spend distribution, concentration, overlap, contract coverage, and changes over time.
How do you conduct vendor spend analysis?
Define the scope, collect transaction exports, normalize vendor identity, classify spend, measure data coverage, build supplier summaries, calculate KPIs, inspect source rows, and validate actions with finance, procurement, and business owners.
What insights does vendor spend analysis provide?
It can show the largest suppliers, spend concentration, fragmented categories, tail spend, verified non-contract purchases, unusual changes, and areas that deserve contract or sourcing review. It does not prove supplier quality or guaranteed savings on its own.
What are the main challenges of vendor spend analysis?
Common challenges include supplier aliases, inconsistent categories, missing contract data, mixed currencies, duplicated transactions, incompatible date bases, different transaction grains, and unsupported assumptions about savings.
Can vendor spend analysis be done in Excel?
Yes. Excel can support vendor mappings, category mappings, formulas, PivotTables, exception lists, and a dashboard for a controlled dataset. Larger or frequently refreshed environments may need a governed BI or procurement platform.
What is the difference between vendor spend analysis and supplier performance analysis?
Vendor spend analysis focuses on money paid or committed to suppliers. Supplier performance analysis evaluates evidence such as delivery, quality, service, and price compliance. The two views can be combined only after their data definitions and periods are aligned.
How can AI help with vendor spend analysis?
AI can help inspect uploaded files, suggest possible aliases and categories, summarize transactions, calculate defined metrics, flag exceptions, and draft a review summary. Users should approve mappings and verify every material conclusion against the source data.
Analyze vendor spend files with hiData
Upload AP, PO, vendor-master, and contract-status exports to hiData AI Sheets. Build an approved vendor mapping, review concentration and category overlap, and create a traceable summary that keeps unsupported assumptions visible for follow-up.