AI financial statement analysis can turn uploaded statements or SEC filing exports into a structured Excel review, but the useful output is not a generic summary. A reliable workflow preserves the source, aligns periods and units, calculates transparent ratios, connects the income statement, balance sheet, and cash flow statement, and sends unusual results back to the underlying rows for human review.
Download the AI financial statement analysis Excel template to follow the illustrative bank example and inspect its formulas.
Key takeaways
- Start with the filing or exported statements, not an AI-generated interpretation. Preserve period, unit, currency, original label, filing form, and source location.
- Use horizontal, common-size, and ratio analysis together. Each method answers a different question, and none establishes a cause on its own.
- Reconcile the three statements before explaining performance. Net income, equity, working capital, financing, and cash movements should form a coherent chain.
- Match ratios to the business model. A bank requires measures such as net interest margin, efficiency ratio, credit quality, and regulatory capital rather than inventory turnover.
- Use AI to structure uploaded files, apply approved calculations, surface exceptions, and draft questions. Finance still validates definitions, source rows, accounting treatment, and conclusions.
What is AI financial statement analysis?
Financial statement analysis evaluates a company's reported performance, financial position, and cash generation. Traditional analysis combines period comparisons, common-size statements, ratios, and the narrative and footnotes that explain the numbers. AI-assisted analysis applies those same disciplines to uploaded files while reducing repetitive preparation work.
The distinction matters. AI can help locate tables, standardize labels, calculate approved metrics, identify outliers, and draft a review memo. It should not invent missing facts, silently combine incompatible periods, decide an accounting treatment, or present an unexplained ratio as an investment recommendation.
The SEC's guide to reading a 10-K points readers to Management's Discussion and Analysis in Item 7 and audited financial statements and notes in Item 8. Those sections belong together: the statements provide the measured result, while MD&A and the notes provide management's explanation, policies, estimates, commitments, and risks.
For an uploaded-file workflow, the objective is a traceable analysis package:
- A normalized statement table that retains original filing references.
- Transparent calculations for trends, common-size percentages, and ratios.
- A dashboard that highlights material movements without hiding the denominator.
- An exception list linked to source rows and follow-up questions.
- A concise draft that separates reported facts, calculations, and hypotheses.
What to collect before opening Excel
At minimum, collect comparable income statements, balance sheets, and cash flow statements for two periods. For a public company, include the relevant 10-K or 10-Q, the filing date, fiscal period, presentation currency, unit scale, and notes needed to interpret material movements. For internal reporting, use approved exports and a chart-of-accounts or mapping file.
The SEC beginner's guide to financial statements explains that the statements, footnotes, and MD&A should be read as a package. A spreadsheet that captures only headline totals can miss debt terms, revenue recognition policies, contingencies, segment changes, restatements, or noncash items that alter the interpretation.
Create a source register before calculating anything. Useful fields include:
| Field | Why it matters |
|---|---|
| Entity and filing form | Prevents cross-company or 10-K/10-Q mixing |
| Fiscal period and period type | Separates annual, quarterly, and year-to-date values |
| Currency and unit scale | Prevents dollars, thousands, and millions from being added |
| Statement and original label | Preserves the reported context |
| Normalized label | Supports repeatable analysis across periods |
| Source page, table, or note | Lets a reviewer return to the evidence |
| Restatement or reclassification flag | Explains why comparative values may have changed |
| Reviewer status | Distinguishes approved mappings from unresolved items |
Do not convert every label automatically. Operating income, income from operations, and a bank's net interest income are not interchangeable simply because all relate to operations. Keep the original label, propose a normalized mapping, and require approval when the meaning is uncertain.
Step 1: Normalize periods, units, and signs
Financial analysis fails quickly when its inputs do not share a basis. Convert display units only after storing the original unit. Confirm whether expenses and cash outflows are positive values in separate rows or negative values in a signed ledger. Check whether quarterly values are standalone quarters or year-to-date totals.
Align period ends and fiscal calendars. A 52-week retailer and a calendar-year manufacturer may not be directly comparable. A bank acquisition, discontinued operation, or restatement may also change the population. Record these scope differences beside the data instead of burying them in a summary paragraph.
Use a visible normalization table with columns for the source label, normalized metric, current period, prior period, source reference, and review status. Unmapped rows should remain visible. A complete-looking dashboard built on silent exclusions is less useful than an incomplete dashboard with an honest exception queue.
Step 2: Perform horizontal analysis
Horizontal analysis measures how a line item changed between periods. Calculate both the absolute change and percentage change:
Absolute change = Current period - Prior period
Percentage change = (Current period - Prior period) / Prior period
The denominator needs control. If the prior period is zero, a percentage change is not meaningful. If values change sign, the percentage may be mathematically correct but operationally misleading. Show N/M or a review flag instead of forcing a dramatic percentage into the dashboard.
Rank movements by both magnitude and materiality. A $10 million movement may be immaterial for total assets but important within a small segment. Conversely, a 200% increase in a tiny balance may not affect the overall conclusion. The review should state the chosen threshold and retain exceptions below it when they are qualitatively important.
Horizontal analysis identifies where to look. It does not establish why the number moved. The SEC Financial Reporting Manual emphasizes that MD&A should explain underlying causes rather than merely recite percentage changes. Use the movement as an index into management commentary, notes, and source records.
Step 3: Build common-size statements
Common-size analysis expresses each line as a percentage of a meaningful base. On an income statement, revenue is usually the base. On a balance sheet, total assets or total liabilities and equity provide the denominator. The result makes structural changes easier to see across periods or companies of different sizes.
For a nonfinancial company, common-size income statement measures might include gross profit, operating expense, operating income, and net income as a percentage of revenue. Balance-sheet measures might include cash, receivables, inventory, debt, and equity as a percentage of total assets.
Do not impose the same structure on a bank. Interest-earning assets, deposits, loans, credit losses, and regulatory capital drive a bank's economics. A bank analysis should use the relevant income and balance-sheet bases and clearly label averages when a ratio uses average assets or average equity.
Common-size results help identify mix changes, but they can hide absolute growth or contraction. A stable operating margin alongside falling revenue tells a different story from the same margin alongside rapid growth. Keep dollar movements and percentages together.
Step 4: Calculate ratios that match the business
Ratios compress relationships between statement lines. They are useful only when the formula, period basis, and source values are visible. For general operating companies, a practical set includes:
| Area | Ratio | Formula |
|---|---|---|
| Profitability | Gross margin | Gross profit / revenue |
| Profitability | Operating margin | Operating income / revenue |
| Profitability | Net margin | Net income / revenue |
| Liquidity | Current ratio | Current assets / current liabilities |
| Liquidity | Quick ratio | Cash + marketable securities + receivables / current liabilities |
| Leverage | Debt-to-equity | Interest-bearing debt / equity |
| Coverage | Interest coverage | EBIT / interest expense |
| Efficiency | Receivables turnover | Revenue / average receivables |
| Efficiency | Inventory turnover | COGS / average inventory |
| Efficiency | Asset turnover | Revenue / average assets |
| Returns | Return on assets | Net income / average assets |
| Returns | Return on equity | Net income / average equity |
| Cash | Operating cash flow ratio | Operating cash flow / current liabilities |
State whether values are period-end or averages. Mixing annual income with a single closing balance can distort turnover and return ratios when the balance changed materially during the year. If only year-end values are available, label the approximation.
Use peer comparisons carefully. Accounting policies, fiscal calendars, acquisitions, geography, product mix, and capital structure can make a numerical comparison look more precise than it is. The spreadsheet should support a question, not erase the business context.
Step 5: Connect the three statements
The strongest financial statement analysis follows the flow between statements. Net income should connect to retained earnings after dividends and other equity movements. The cash flow statement should reconcile opening and closing cash after operating, investing, and financing activities. Working-capital changes should have consistent signs and plausible relationships to receivables, inventory, payables, and revenue.
Useful cross-statement checks include:
- Closing cash on the cash flow statement equals cash and cash equivalents on the balance sheet, subject to disclosed classification differences.
- Net income used in operating cash flow agrees with the income statement.
- Depreciation and other noncash charges are reconciled in operating activities and relate to the asset schedule or notes.
- Capital expenditures correspond to investing cash outflows and changes in property, plant, and equipment.
- New borrowing, repayments, and equity transactions correspond to financing cash flows and balance-sheet movements.
- Retained earnings changes reconcile net income, dividends, and other disclosed adjustments.
When a check fails, do not plug the difference into an Other row. Record the variance, trace the source, and document whether the cause is rounding, presentation, scope, foreign exchange, reclassification, or a data extraction error.
Worked example: bank financial statement and filing analysis
The downloadable workbook uses an illustrative bank dataset in millions of dollars. It is designed to mirror the analysis pattern in hiData's Bank Financial Statement & SEC Filing Analysis case library without presenting a customer result or a real institution's figures.
The sample compares 2025 with 2024. Net interest income rises from $182 million to $196 million, while provision for credit losses increases from $18 million to $24 million. Noninterest expense increases from $142 million to $151 million. Net income reaches $60 million, up from $55 million, but asset growth and credit-quality changes require more context than the income increase alone provides.
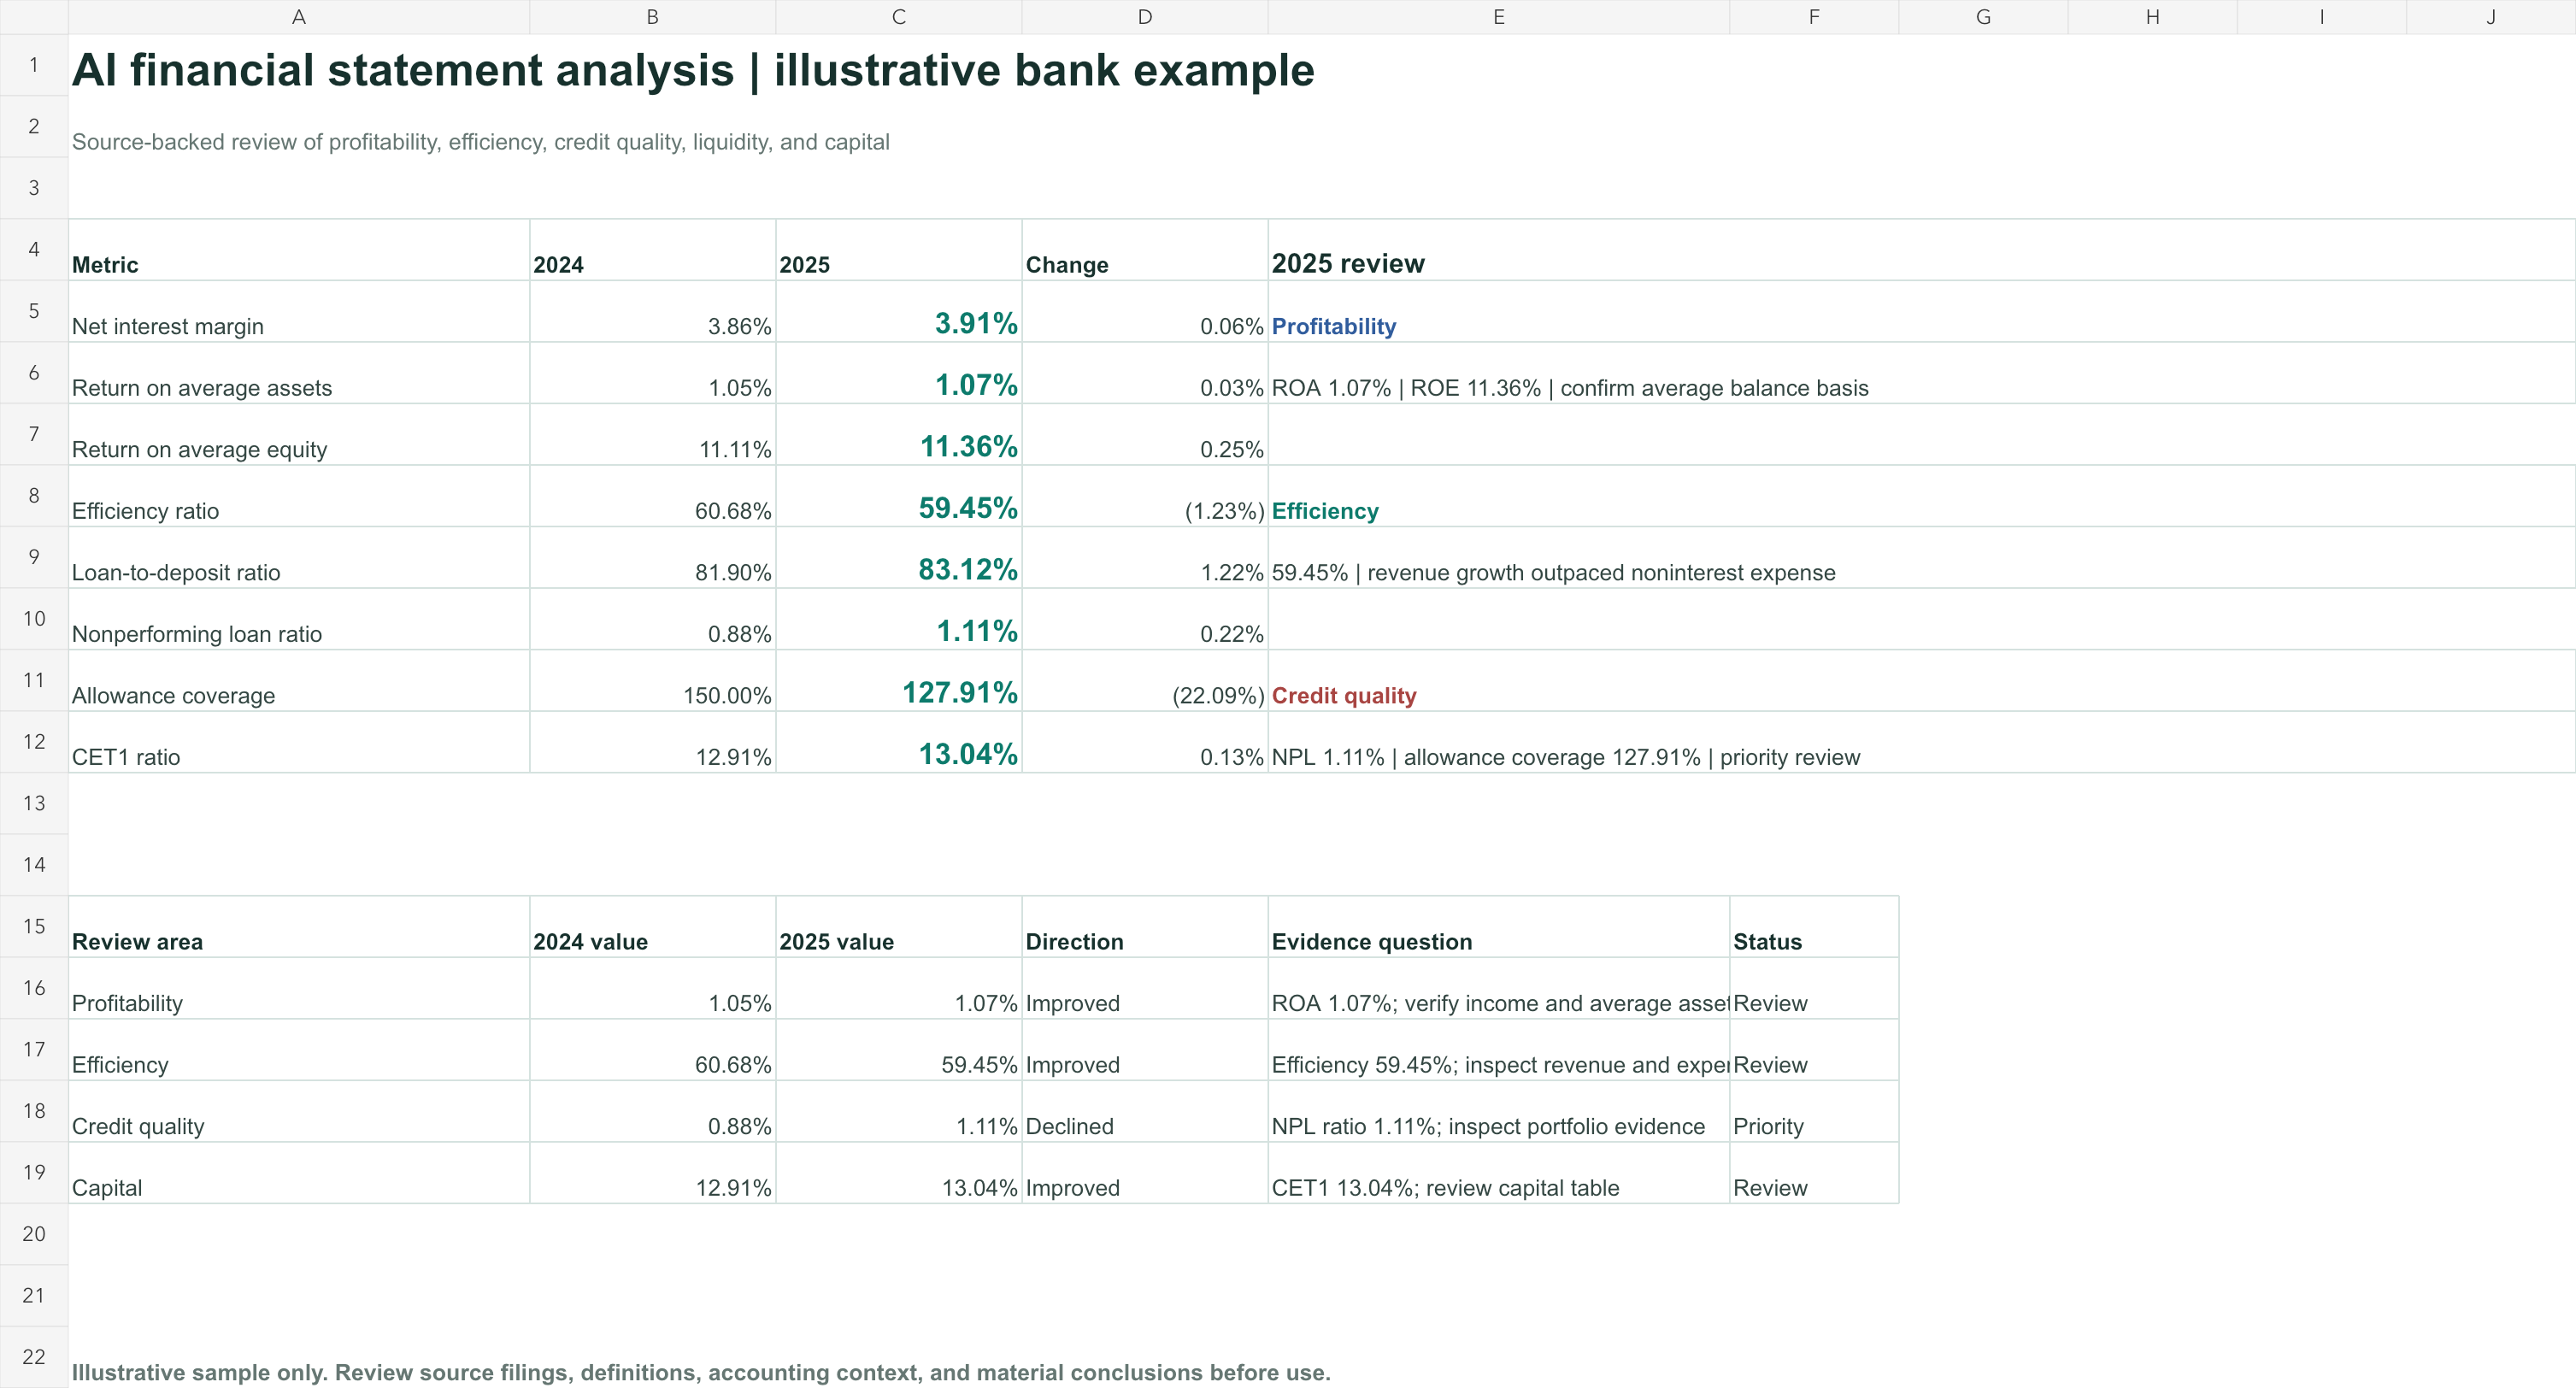
Bank ratios differ from ratios used for a manufacturer or retailer. The workbook calculates:
| Metric | 2024 | 2025 | Review question |
|---|---|---|---|
| Net interest margin | 3.86% | 3.91% | Did asset mix or funding cost change? |
| Return on average assets | 1.05% | 1.07% | Did earnings keep pace with asset growth? |
| Return on average equity | 11.11% | 11.36% | Is the change driven by profit or capital structure? |
| Efficiency ratio | 60.68% | 59.45% | Are revenue gains outpacing noninterest expense? |
| Loan-to-deposit ratio | 81.90% | 83.12% | Is loan growth changing liquidity or funding needs? |
| Nonperforming loan ratio | 0.88% | 1.11% | Which portfolios explain the deterioration? |
| Allowance coverage | 150.00% | 127.91% | Does reserve coverage remain appropriate for the risk mix? |
| CET1 ratio | 12.91% | 13.04% | What changed in capital and risk-weighted assets? |
The FDIC Quarterly Banking Profile graph book uses measures such as return on assets, net interest margin, charge-offs, loss allowance, and capital ratios to describe industry performance. Formula definitions and peer bases still need to be aligned; the FDIC BankFind methodology provides useful context for official ratios.
In the example, profitability improves modestly, but the nonperforming loan ratio rises and allowance coverage falls. That combination is a review signal, not a conclusion that credit risk is inadequate. A reviewer should inspect loan composition, delinquencies, charge-offs, allowance methodology, economic assumptions, and management commentary before interpreting the change.
How to structure the Excel workbook
A useful workbook keeps the executive answer near the calculations and preserves a route back to the source. The included template uses five focused sheets:
- Dashboard: current and prior ratios, year-over-year changes, review signals, and a trend chart.
- Filing Data: normalized line items for income, balance-sheet, credit, and capital data. Yellow cells are editable inputs.
- Ratio Analysis: formulas, numerator and denominator references, and interpretation prompts.
- Source Map: original labels, normalized metrics, form, period, unit, source location, and review status.
- Method: calculation definitions, controls, and limitations.
Derived values are formula-driven. Updating the yellow input cells changes ratios and the dashboard. The source map does not feed unsupported narrative into the model; it documents how each value was mapped and whether it was reviewed.
This structure is more useful than a dashboard alone. A chart can show that allowance coverage declined, but the calculation sheet reveals that both the allowance and nonperforming loan balance changed. The source map then shows where each input came from.
An AI-assisted workflow with uploaded files
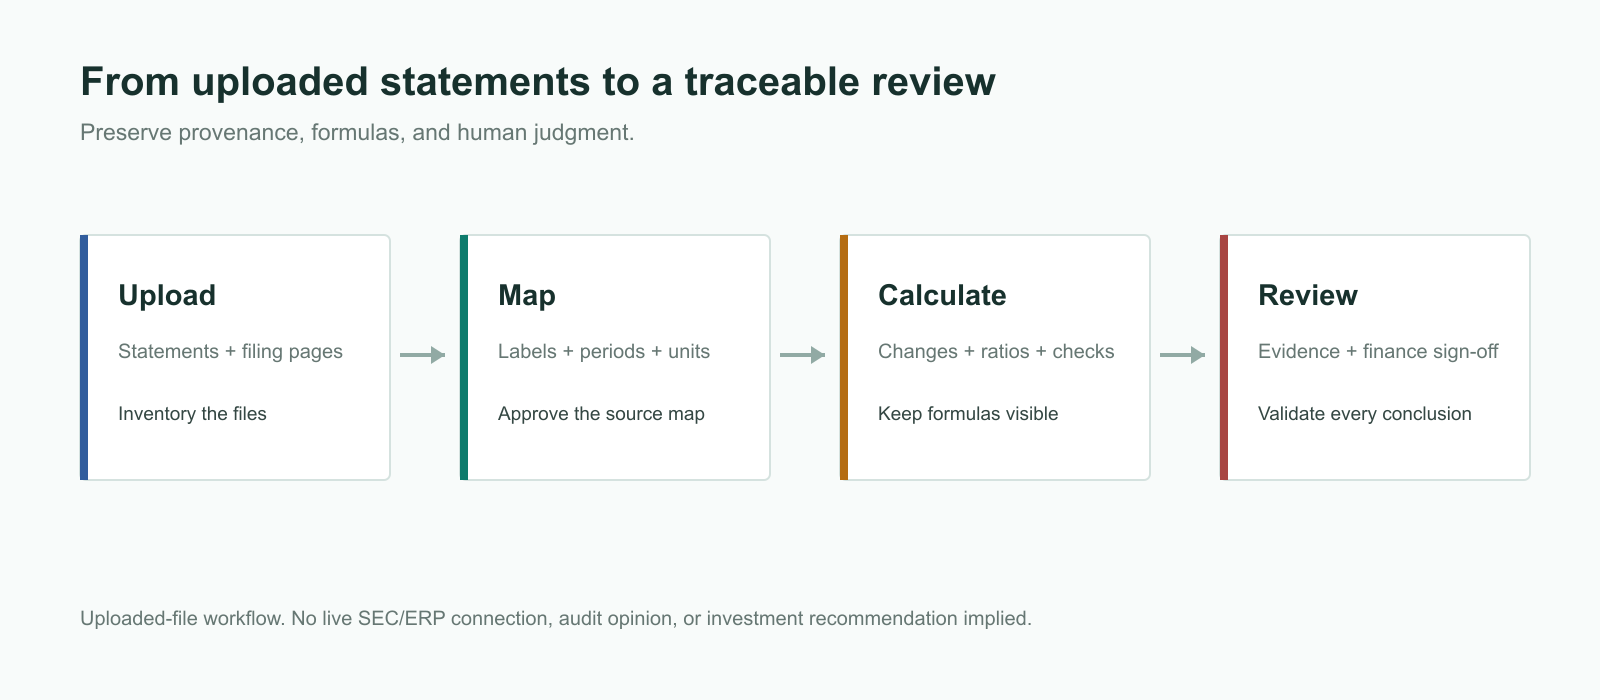
With hiData AI Sheets, users can upload supported Excel or CSV statement exports and ask for structured analysis. The workflow should begin with data inspection, not conclusions.
1. Inspect and inventory the files
Ask AI to identify entities, periods, statements, units, currencies, duplicate tables, missing pages, and labels that cannot be mapped confidently. The output should be an exception list, not an automatically completed model.
2. Build a proposed source map
Request a table that preserves every original label and proposes a normalized metric. Include the source page or table and a confidence or review field. Approve mappings before calculations use them.
3. Apply defined calculations
Provide the formulas and denominator rules. Ask for horizontal changes, common-size values, ratios, and reconciliation checks. Require N/M, blank, or a review flag when a denominator is zero or the period basis is incompatible.
4. Trace material movements
For every flagged metric, request the underlying rows, statement references, and relevant notes or MD&A passages from the uploaded files. Separate direct evidence from an inferred explanation.
5. Draft a review memo
Ask for a concise summary organized into reported facts, calculated observations, unresolved questions, and required human review. The memo should not provide investment advice or assert causes that are not supported by the source documents.
Prompts for financial statement analysis
Source and data-quality review
Review the uploaded financial statement exports and filing-derived tables. List the entity, form, fiscal periods, statement type, currency, unit scale, duplicate tables, missing values, and labels that need manual mapping. Preserve original labels and source locations. Do not infer missing amounts.
Three-statement analysis
Using only approved mappings, calculate absolute and percentage changes, common-size percentages, and the supplied ratios. Show each numerator, denominator, formula, and source reference. Flag zero denominators, sign changes, incompatible periods, and failed cash or equity reconciliations.
Bank filing review
Calculate net interest margin, return on average assets, return on average equity, efficiency ratio, loan-to-deposit ratio, nonperforming loan ratio, allowance coverage, and CET1 ratio. Use the definitions supplied in the workbook. Separate reported facts from questions that require note or MD&A review.
Management review draft
Draft a one-page review with four sections: confirmed movements, ratio observations, cross-statement checks, and open questions. Link every material statement to a source row or filing location. Do not give investment advice or claim a cause without supporting evidence.
Controls that keep the analysis reliable
Source provenance. Keep the form, period, unit, original label, and source location beside each value. A number without provenance is difficult to audit and easy to misuse.
Approved definitions. Store formulas in one calculation table. Do not let separate prompts produce different versions of the same ratio.
Restatement control. When the comparative period has been restated, preserve both the originally reported and restated value when available, and state which basis the analysis uses.
Materiality and qualitative flags. Use quantitative thresholds to organize review, but retain significant legal, liquidity, covenant, regulatory, or accounting matters even when the amount is small.
Cross-statement reconciliation. Treat failed cash, debt, equity, or retained-earnings checks as data-quality exceptions before interpreting business performance.
Human finance review. A qualified reviewer should confirm classifications, accounting treatment, management explanations, ratio definitions, and the final narrative. AI output is a draft analytical aid, not an audit opinion.
Common mistakes
Analyzing only the income statement. Profit can improve while cash conversion, leverage, or credit quality deteriorates. Connect the statements and notes.
Comparing incompatible periods. Annual, quarterly, and year-to-date values need explicit treatment. Never compare them because the column headers look similar.
Ignoring units and signs. A statement in thousands and another in millions can produce plausible-looking but meaningless ratios. Preserve the original scale and normalize once.
Using generic ratios for every industry. Inventory turnover is relevant for many operating companies but not for a bank. Choose ratios that reflect the business model.
Treating correlation as explanation. Two lines moving together does not establish a causal relationship. Use notes, MD&A, segment detail, and source records.
Hiding uncertainty. An unmapped label, missing average balance, or unknown restatement should appear as an exception. Do not replace uncertainty with a confident sentence.
How this fits with related finance workflows
Use this workflow when the starting point is a financial statement or filing export and the objective is to understand reported performance, position, cash generation, and risk signals. For a narrower income-statement review, see P&L analysis with AI. For planning, scenarios, and management forecasting, use the AI for FP&A pillar.
Valuation is a separate next step. A discounted cash flow analysis in Excel converts forecast cash flows and assumptions into an estimate of value; it should not be merged into the historical statement review. Likewise, bank reconciliation verifies internal cash records against bank activity and answers a different control question.
Once the analysis is approved, teams can use an Excel-to-PowerPoint workflow to prepare a review deck without changing the underlying definitions.
Frequently asked questions
Can AI analyze financial statements?
Yes. AI can help structure uploaded statements, map labels, apply approved formulas, identify exceptions, and draft summaries. A finance reviewer should verify the source data, mappings, accounting context, and material conclusions.
What are the three main methods of financial statement analysis?
Horizontal analysis compares periods, vertical or common-size analysis expresses lines as a percentage of a base, and ratio analysis evaluates relationships between statement values. A complete review also connects the three statements and reads the notes and MD&A.
Can financial statement analysis be done in Excel?
Yes. Excel is useful for visible mappings, repeatable formulas, ratio schedules, reconciliation checks, dashboards, and source-level review. The downloadable template demonstrates a focused bank filing example.
Which ratios should be included?
Choose ratios that match the business and question. General companies often use margins, liquidity, leverage, coverage, turnover, ROA, ROE, and cash-flow ratios. Banks require measures such as net interest margin, efficiency, loan-to-deposit, credit quality, allowance coverage, and capital ratios.
What is the difference between financial statement analysis and FP&A?
Financial statement analysis primarily interprets reported historical results and position. FP&A uses actuals together with budgets, forecasts, scenarios, and operating drivers to support future decisions.
Does hiData connect directly to the SEC or an ERP?
This workflow is based on files the user uploads. It does not claim a direct SEC, ERP, accounting-system, or database connection, automatic live refresh, or autonomous filing extraction.
Can AI make investment decisions from financial statements?
No automated conclusion should replace professional judgment. Financial statements are only part of an investment decision, and this workflow is intended for analysis and review rather than personalized investment advice.
Analyze uploaded financial statements with hiData
Upload supported statement exports to hiData AI Sheets, preserve the source map, apply approved ratios, review exceptions, and produce a traceable finance summary. Keep accounting judgments and final decisions with the responsible human reviewer.